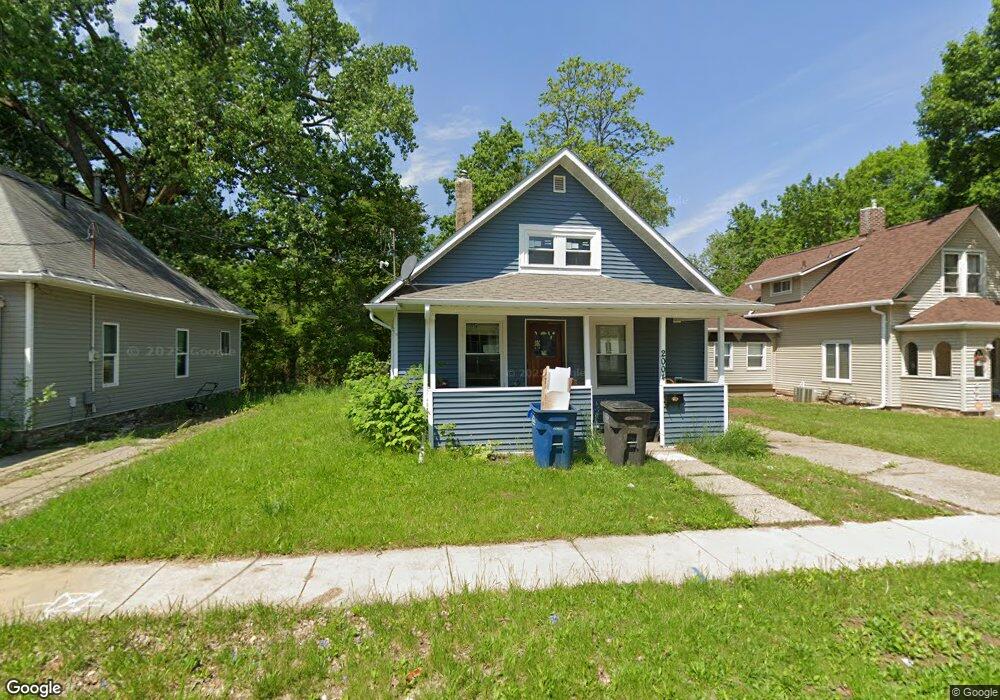
2004 10th St Des Moines, IA 50314
King Irving NeighborhoodEstimated Value: $105,000 - $118,680
2
Beds
1
Bath
978
Sq Ft
$113/Sq Ft
Est. Value
About This Home
This home is located at 2004 10th St, Des Moines, IA 50314 and is currently estimated at $110,670, approximately $113 per square foot. 2004 10th St is a home located in Polk County with nearby schools including Moulton Elementary School, Harding Middle School, and North High School.
Ownership History
Date
Name
Owned For
Owner Type
Purchase Details
Closed on
Apr 27, 2005
Sold by
Bruce Steve K
Bought by
Bosteder Earl
Current Estimated Value
Home Financials for this Owner
Home Financials are based on the most recent Mortgage that was taken out on this home.
Original Mortgage
$47,160
Outstanding Balance
$24,777
Interest Rate
6.06%
Mortgage Type
Fannie Mae Freddie Mac
Estimated Equity
$85,893
Purchase Details
Closed on
Oct 14, 1999
Sold by
Ira Anthony E Schubert
Bought by
Bruce Steve K
Home Financials for this Owner
Home Financials are based on the most recent Mortgage that was taken out on this home.
Original Mortgage
$30,000
Interest Rate
7.5%
Mortgage Type
Balloon
Purchase Details
Closed on
Jul 1, 1997
Sold by
Jones Jeffrey P
Bought by
Bruce Steve K
Purchase Details
Closed on
Jun 28, 1997
Sold by
Jones Jeffrey P
Bought by
Guaranty Bank & Trust Company and Anthony E Schubert Irrevocable Trust
Create a Home Valuation Report for This Property
The Home Valuation Report is an in-depth analysis detailing your home's value as well as a comparison with similar homes in the area
Home Values in the Area
Average Home Value in this Area
Purchase History
| Date | Buyer | Sale Price | Title Company |
|---|---|---|---|
| Bosteder Earl | $52,000 | -- | |
| Bruce Steve K | $24,500 | -- | |
| Bruce Steve K | $25,000 | -- | |
| Guaranty Bank & Trust Company | $15,500 | -- |
Source: Public Records
Mortgage History
| Date | Status | Borrower | Loan Amount |
|---|---|---|---|
| Open | Bosteder Earl | $47,160 | |
| Previous Owner | Bruce Steve K | $30,000 |
Source: Public Records
Tax History
| Year | Tax Paid | Tax Assessment Tax Assessment Total Assessment is a certain percentage of the fair market value that is determined by local assessors to be the total taxable value of land and additions on the property. | Land | Improvement |
|---|---|---|---|---|
| 2025 | $1,472 | $86,600 | $17,600 | $69,000 |
| 2024 | $1,472 | $74,800 | $15,200 | $59,600 |
| 2023 | $1,438 | $74,800 | $15,200 | $59,600 |
| 2022 | $1,426 | $61,000 | $12,600 | $48,400 |
| 2021 | $1,330 | $61,000 | $12,600 | $48,400 |
| 2020 | $1,382 | $53,300 | $11,100 | $42,200 |
| 2019 | $1,936 | $53,300 | $11,100 | $42,200 |
| 2018 | $1,280 | $48,100 | $10,000 | $38,100 |
| 2017 | $1,234 | $48,100 | $10,000 | $38,100 |
| 2016 | $1,202 | $45,600 | $9,300 | $36,300 |
| 2015 | $1,202 | $45,600 | $9,300 | $36,300 |
| 2014 | $1,138 | $42,800 | $8,800 | $34,000 |
Source: Public Records
Map
Nearby Homes
Your Personal Tour Guide
Ask me questions while you tour the home.