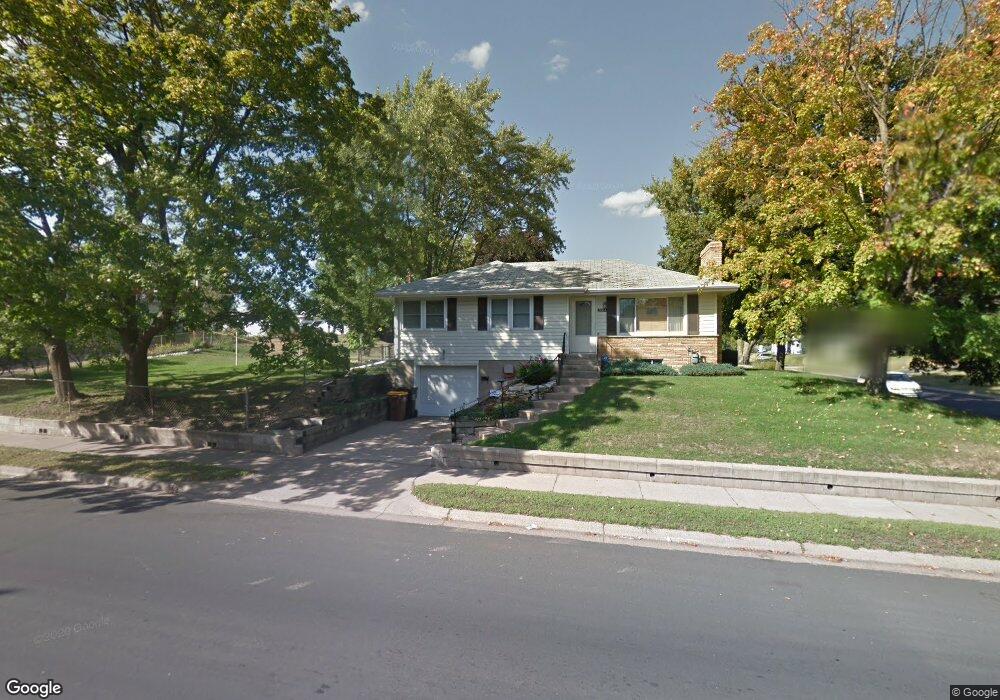
2004 2004 Thompson Ave South St. Paul, MN 55075
Estimated Value: $276,038 - $284,000
3
Beds
1
Bath
926
Sq Ft
$302/Sq Ft
Est. Value
About This Home
This home is located at 2004 2004 Thompson Ave, South St. Paul, MN 55075 and is currently estimated at $279,760, approximately $302 per square foot. 2004 2004 Thompson Ave is a home located in Dakota County with nearby schools including Lincoln Center Elementary, South St. Paul Secondary, and Academic Arts High School.
Ownership History
Date
Name
Owned For
Owner Type
Purchase Details
Closed on
Oct 31, 2017
Sold by
Harrer William C
Bought by
Flores Cesar Marquez
Current Estimated Value
Home Financials for this Owner
Home Financials are based on the most recent Mortgage that was taken out on this home.
Original Mortgage
$141,520
Outstanding Balance
$118,524
Interest Rate
3.83%
Mortgage Type
New Conventional
Estimated Equity
$161,236
Purchase Details
Closed on
Feb 28, 2017
Sold by
Powers James James
Bought by
Harrer William
Home Financials for this Owner
Home Financials are based on the most recent Mortgage that was taken out on this home.
Original Mortgage
$10,000
Interest Rate
4.09%
Mortgage Type
Credit Line Revolving
Create a Home Valuation Report for This Property
The Home Valuation Report is an in-depth analysis detailing your home's value as well as a comparison with similar homes in the area
Home Values in the Area
Average Home Value in this Area
Purchase History
| Date | Buyer | Sale Price | Title Company |
|---|---|---|---|
| Flores Cesar Marquez | $176,900 | Dca Title | |
| Harrer William | $173,500 | -- | |
| Harrer William C | $173,500 | Partners Title Llc |
Source: Public Records
Mortgage History
| Date | Status | Borrower | Loan Amount |
|---|---|---|---|
| Open | Flores Cesar Marquez | $141,520 | |
| Previous Owner | Harrer William C | $10,000 | |
| Previous Owner | Harrer William | $173,500 |
Source: Public Records
Tax History Compared to Growth
Tax History
| Year | Tax Paid | Tax Assessment Tax Assessment Total Assessment is a certain percentage of the fair market value that is determined by local assessors to be the total taxable value of land and additions on the property. | Land | Improvement |
|---|---|---|---|---|
| 2024 | $3,072 | $224,000 | $57,600 | $166,400 |
| 2023 | $3,072 | $219,600 | $57,900 | $161,700 |
| 2022 | $2,572 | $214,000 | $57,900 | $156,100 |
| 2021 | $2,422 | $184,700 | $50,300 | $134,400 |
| 2020 | $2,354 | $170,500 | $47,900 | $122,600 |
| 2019 | $2,186 | $170,000 | $45,700 | $124,300 |
| 2018 | $1,850 | $150,700 | $41,500 | $109,200 |
| 2017 | $1,752 | $142,800 | $39,500 | $103,300 |
| 2016 | $1,770 | $128,800 | $36,000 | $92,800 |
| 2015 | $1,671 | $99,010 | $27,089 | $71,921 |
| 2014 | -- | $98,029 | $27,015 | $71,014 |
| 2013 | -- | $84,513 | $22,774 | $61,739 |
Source: Public Records
Map
Nearby Homes
- 601 Levander Way Unit 101
- 601 Levander Way Unit 208
- 921 17th Ave N
- 818 16th Ave N
- 522 16th Ave N
- 2205 Acorn Ln
- 436 17th Ave N
- 425 16th Ave N
- 934 15th Ave N
- 606 13th Ave N
- 1365 Christensen Ave
- 1044 17th Ave N
- 1200 Dwane St
- 362 Trenton Ln
- 1518 Traverse Ln
- 358 Trenton Ln
- 1537 Traverse Ln
- 1541 Traverse Ln
- 364 Trenton Ln
- 1523 Traverse Ln
- 2004 2004 Thompson-Avenue-
- 2004 Thompson Ave
- 707 20th Ave N
- 713 20th Ave N
- 2005 Thompson Ave
- 2010 Thompson Ave
- 2010 2010 Thompson Ave
- 1916 Thompson Ave
- 1916 1916 Thompson-Avenue-
- 1916 1916 Thompson Ave
- 652 Cresthaven Dr
- 721 20th Ave N
- 652 652 Cresthaven Dr
- 718 20th Ave N
- 718 718 20th Ave N
- 720 21st Ave N
- 729 729 20th Ave N
- 729 20th Ave N
- 722 20th Ave N
- 644 Cresthaven Dr