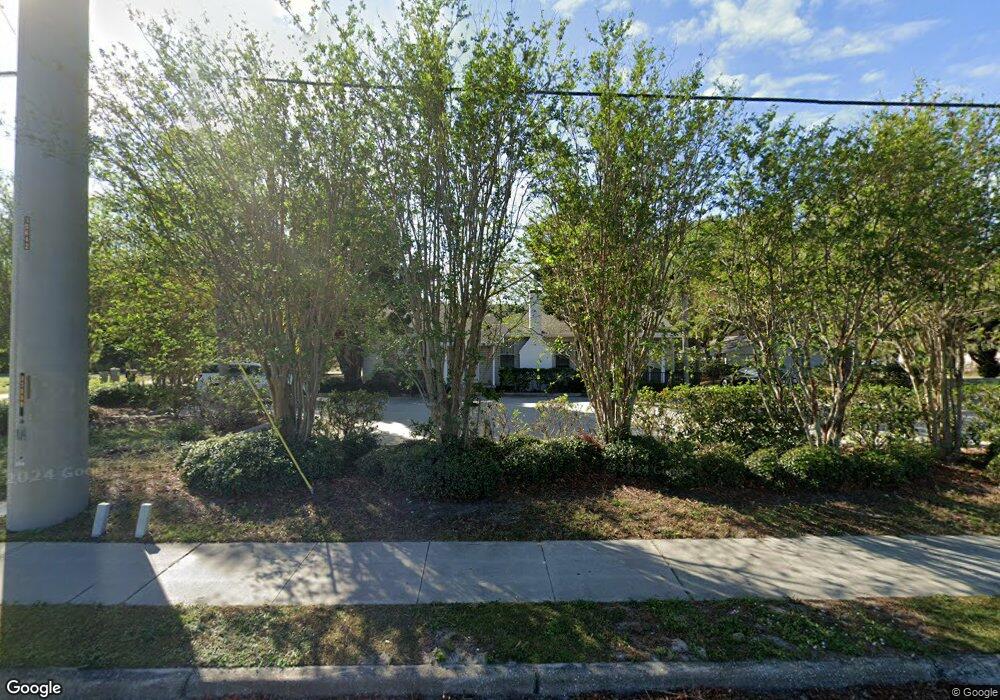
2004 53rd Ave E Bradenton, FL 34203
Oneco NeighborhoodEstimated Value: $410,850
2
Beds
1
Bath
2,852
Sq Ft
$144/Sq Ft
Est. Value
About This Home
This home is located at 2004 53rd Ave E, Bradenton, FL 34203 and is currently estimated at $410,850, approximately $144 per square foot. 2004 53rd Ave E is a home located in Manatee County with nearby schools including Oneco Elementary School, W. D. Sugg Middle School, and Southeast High School.
Ownership History
Date
Name
Owned For
Owner Type
Purchase Details
Closed on
Sep 10, 2020
Sold by
Loyal Land Company Llc
Bought by
Dnd Land Llc
Current Estimated Value
Purchase Details
Closed on
Apr 17, 2009
Sold by
Angel Quest Llc
Bought by
Loyal Land Company Llc
Home Financials for this Owner
Home Financials are based on the most recent Mortgage that was taken out on this home.
Original Mortgage
$250,000
Interest Rate
5.18%
Mortgage Type
Commercial
Purchase Details
Closed on
Oct 22, 2001
Sold by
Boyer Kevin L and Boyer Mitzi Michelle
Bought by
Angel Quest L L C
Home Financials for this Owner
Home Financials are based on the most recent Mortgage that was taken out on this home.
Original Mortgage
$152,000
Interest Rate
6.87%
Purchase Details
Closed on
Feb 22, 2000
Sold by
Hill Herbert J and Byers Joseph H
Bought by
Boyer Kevin L and Boyer Mitzi Michele Renee
Home Financials for this Owner
Home Financials are based on the most recent Mortgage that was taken out on this home.
Original Mortgage
$102,663
Interest Rate
8.17%
Mortgage Type
Commercial
Create a Home Valuation Report for This Property
The Home Valuation Report is an in-depth analysis detailing your home's value as well as a comparison with similar homes in the area
Home Values in the Area
Average Home Value in this Area
Purchase History
| Date | Buyer | Sale Price | Title Company |
|---|---|---|---|
| Dnd Land Llc | $280,000 | Barnes Walker Title Inc | |
| Loyal Land Company Llc | $250,000 | Attorney | |
| Angel Quest L L C | $170,000 | -- | |
| Boyer Kevin L | $125,000 | -- |
Source: Public Records
Mortgage History
| Date | Status | Borrower | Loan Amount |
|---|---|---|---|
| Previous Owner | Loyal Land Company Llc | $250,000 | |
| Previous Owner | Angel Quest L L C | $152,000 | |
| Previous Owner | Boyer Kevin L | $102,663 |
Source: Public Records
Tax History
| Year | Tax Paid | Tax Assessment Tax Assessment Total Assessment is a certain percentage of the fair market value that is determined by local assessors to be the total taxable value of land and additions on the property. | Land | Improvement |
|---|---|---|---|---|
| 2025 | $4,586 | $256,335 | $140,359 | $115,976 |
| 2023 | $4,581 | $253,181 | $131,169 | $122,012 |
| 2022 | $4,227 | $230,973 | $88,678 | $142,295 |
| 2021 | $4,150 | $232,303 | $88,678 | $143,625 |
| 2020 | $4,262 | $232,303 | $88,678 | $143,625 |
| 2019 | $4,018 | $220,692 | $88,678 | $132,014 |
| 2018 | $3,619 | $187,162 | $88,678 | $98,484 |
| 2017 | $3,455 | $187,162 | $0 | $0 |
| 2016 | $3,377 | $186,172 | $0 | $0 |
Source: Public Records
Map
Nearby Homes
- 5409 18th Street Blvd E
- 5128 18th Ln E
- 5223 17th Street Ct E
- 4901 20th Street Ct E
- 2003 51st Ave E
- 1622 51st Ave E
- 302 51st Ave E
- 5207 15th Street Ct E
- 5311 24th Street Ct E
- 5612 22nd St E
- 1020 301 Blvd E
- 5528 24th St E
- 4907 21st Way E
- 1313 54th Ave E Unit 1313
- 1219 51st Ave E Unit 148
- 1219 51st Ave E Unit 9
- 1219 51st Ave E Unit 176
- 1219 51st Ave E Unit 164
- 1219 51st Ave E Unit 103
- 1219 51st Ave E Unit Lot 24
- 5314 20th Street Ct E
- 2008 53rd Ave E
- 5320 20th Street Ct E
- 5214 20th Street Ct E
- 2010 53rd Ave E Unit 1
- 5326 20th Street Ct E
- 1920 53rd Ave E
- 5212 20th Street Ct E
- 5336 20th Street Ct E
- 5215 20th Street Ct E
- 1919 53rd Ave E
- 2104 53rd Ave E
- 5340 20th Street Ct E
- 5208 20th Street Ct E
- 5321 18th Street Blvd E
- 5211 20th Street Ct E
- 5335 18th Street Blvd E
- 5209 20th Street Ct E
- 2108 53rd Ave E
- 5206 20th Street Ct E
Your Personal Tour Guide
Ask me questions while you tour the home.