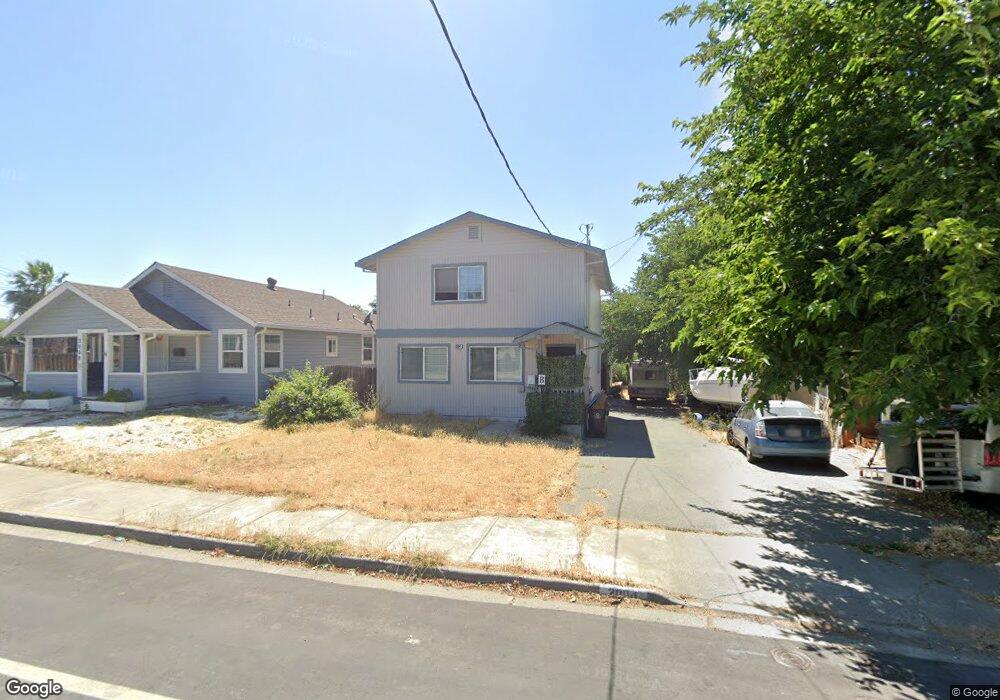
2004 Cavallo Rd Antioch, CA 94509
North Antioch NeighborhoodEstimated Value: $736,000 - $882,314
4
Beds
3
Baths
1,600
Sq Ft
$506/Sq Ft
Est. Value
About This Home
This home is located at 2004 Cavallo Rd, Antioch, CA 94509 and is currently estimated at $809,329, approximately $505 per square foot. 2004 Cavallo Rd is a home located in Contra Costa County with nearby schools including Kimball Elementary School, Antioch Middle School, and Antioch High School.
Ownership History
Date
Name
Owned For
Owner Type
Purchase Details
Closed on
Jan 24, 2025
Sold by
Hull Xu and Hull Stacey Li
Bought by
Hull Xu And Stacey Li Family Trust and Xu
Current Estimated Value
Purchase Details
Closed on
Jun 11, 2019
Sold by
Clemenson Matt and Clemenson Dolores
Bought by
Hull Xu and Li Stacey W
Purchase Details
Closed on
May 10, 2010
Sold by
Reco Investors Llc
Bought by
Clemenson Matt and Clemenson Dolores
Home Financials for this Owner
Home Financials are based on the most recent Mortgage that was taken out on this home.
Original Mortgage
$240,562
Interest Rate
5.21%
Mortgage Type
FHA
Purchase Details
Closed on
Sep 22, 2009
Sold by
Sidrian Michelle P
Bought by
Reco Investors Llc
Purchase Details
Closed on
Jun 29, 2007
Sold by
Sidrian Michelle P
Bought by
Sidrian Michelle P and Sidrian Manuel
Purchase Details
Closed on
Apr 17, 2002
Sold by
Oleary Richard A and Oleary Sandra L
Bought by
Sidrian Michelle P
Create a Home Valuation Report for This Property
The Home Valuation Report is an in-depth analysis detailing your home's value as well as a comparison with similar homes in the area
Home Values in the Area
Average Home Value in this Area
Purchase History
| Date | Buyer | Sale Price | Title Company |
|---|---|---|---|
| Hull Xu And Stacey Li Family Trust | -- | None Listed On Document | |
| Hull Xu | $672,000 | First American Title Company | |
| Clemenson Matt | $255,000 | Old Republic Title Company | |
| Reco Investors Llc | $171,100 | None Available | |
| Sidrian Michelle P | -- | North American Title Co | |
| Sidrian Michelle P | $62,500 | First American Title Co |
Source: Public Records
Mortgage History
| Date | Status | Borrower | Loan Amount |
|---|---|---|---|
| Previous Owner | Clemenson Matt | $240,562 |
Source: Public Records
Tax History
| Year | Tax Paid | Tax Assessment Tax Assessment Total Assessment is a certain percentage of the fair market value that is determined by local assessors to be the total taxable value of land and additions on the property. | Land | Improvement |
|---|---|---|---|---|
| 2025 | $9,497 | $749,623 | $269,953 | $479,670 |
| 2024 | $9,019 | $734,925 | $264,660 | $470,265 |
| 2023 | $9,019 | $720,516 | $259,471 | $461,045 |
| 2022 | $8,880 | $706,389 | $254,384 | $452,005 |
| 2021 | $8,530 | $692,540 | $249,397 | $443,143 |
| 2019 | $4,190 | $295,064 | $95,461 | $199,603 |
| 2018 | $4,042 | $289,280 | $93,590 | $195,690 |
| 2017 | $3,929 | $283,608 | $91,755 | $191,853 |
| 2016 | $3,827 | $278,048 | $89,956 | $188,092 |
| 2015 | $3,776 | $273,872 | $88,605 | $185,267 |
| 2014 | $3,657 | $268,508 | $86,870 | $181,638 |
Source: Public Records
Map
Nearby Homes
- 2010 Cavallo Rd
- 2010 Cavallo Rd Unit 5
- 2010 Cavallo Rd Unit 6
- 2010 Cavallo Rd Unit 3
- 2010 Cavallo Rd Unit 2
- 2010 Cavallo Rd Unit 4
- 2010 Cavallo Rd Unit 14
- 2000 Cavallo Rd
- 2012 Cavallo Rd
- 2012 Cavallo Rd Unit 6
- 2012 Cavallo Rd Unit 5
- 2012 Cavallo Rd Unit 58
- 2008 Cavallo Rd
- 2021 Woodland Dr
- 2025 Woodland Dr
- 2017 Woodland Dr
- 2018 Cavallo Rd
- 2029 Woodland Dr
- 2013 Woodland Dr
- 1938 Cavallo Rd
Your Personal Tour Guide
Ask me questions while you tour the home.