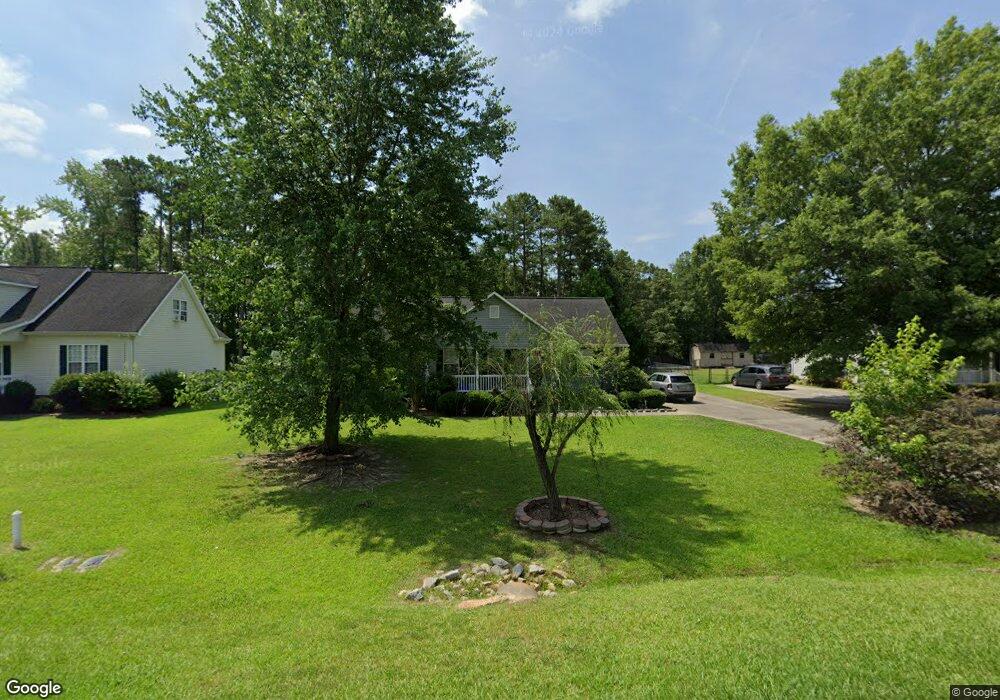
2004 Hunters Ridge Rd Lancaster, SC 29720
Estimated Value: $215,000 - $278,000
--
Bed
3
Baths
1,428
Sq Ft
$179/Sq Ft
Est. Value
About This Home
This home is located at 2004 Hunters Ridge Rd, Lancaster, SC 29720 and is currently estimated at $256,129, approximately $179 per square foot. 2004 Hunters Ridge Rd is a home located in Lancaster County with nearby schools including Brooklyn Springs Elementary School, South Middle School, and Lancaster High School.
Ownership History
Date
Name
Owned For
Owner Type
Purchase Details
Closed on
Aug 5, 2009
Sold by
Secretary Of Housing & Urban Development
Bought by
Loudermilk Robert and Loudermilk Amy
Current Estimated Value
Home Financials for this Owner
Home Financials are based on the most recent Mortgage that was taken out on this home.
Original Mortgage
$77,330
Outstanding Balance
$50,548
Interest Rate
5.26%
Mortgage Type
FHA
Estimated Equity
$205,581
Purchase Details
Closed on
Dec 16, 2008
Sold by
Truesdale Tonya
Bought by
Secretary Of Housing & Urban Development
Purchase Details
Closed on
Aug 3, 2005
Sold by
Harper & Hagins Builders Llc
Bought by
Turesdale Tonya
Home Financials for this Owner
Home Financials are based on the most recent Mortgage that was taken out on this home.
Original Mortgage
$136,852
Interest Rate
5.57%
Mortgage Type
FHA
Purchase Details
Closed on
May 4, 2005
Sold by
Delta Development Group
Bought by
Harper & Hagins Builders Llc
Create a Home Valuation Report for This Property
The Home Valuation Report is an in-depth analysis detailing your home's value as well as a comparison with similar homes in the area
Home Values in the Area
Average Home Value in this Area
Purchase History
| Date | Buyer | Sale Price | Title Company |
|---|---|---|---|
| Loudermilk Robert | $83,000 | -- | |
| Secretary Of Housing & Urban Development | $2,500 | -- | |
| Turesdale Tonya | $139,000 | -- | |
| Harper & Hagins Builders Llc | $11,650 | -- |
Source: Public Records
Mortgage History
| Date | Status | Borrower | Loan Amount |
|---|---|---|---|
| Open | Loudermilk Robert | $77,330 | |
| Previous Owner | Turesdale Tonya | $136,852 |
Source: Public Records
Tax History Compared to Growth
Tax History
| Year | Tax Paid | Tax Assessment Tax Assessment Total Assessment is a certain percentage of the fair market value that is determined by local assessors to be the total taxable value of land and additions on the property. | Land | Improvement |
|---|---|---|---|---|
| 2024 | $914 | $5,964 | $720 | $5,244 |
| 2023 | $911 | $5,964 | $720 | $5,244 |
| 2022 | $908 | $5,964 | $720 | $5,244 |
| 2021 | $888 | $5,964 | $720 | $5,244 |
| 2020 | $846 | $5,516 | $720 | $4,796 |
| 2019 | $1,867 | $5,516 | $720 | $4,796 |
| 2018 | $1,689 | $5,192 | $720 | $4,472 |
| 2017 | $777 | $0 | $0 | $0 |
| 2016 | $758 | $0 | $0 | $0 |
| 2015 | $623 | $0 | $0 | $0 |
| 2014 | $623 | $0 | $0 | $0 |
| 2013 | $623 | $0 | $0 | $0 |
Source: Public Records
Map
Nearby Homes
- 5142 Sedgefield Dr
- 1976 McIlwain Rd
- 5064 Sedgefield Dr
- 2599 State Road S-29-503
- 2744 Lyndell Way
- 4131 Doe Ridge Ln
- 3347 Silver Fox Cir
- 1156 Suttle Rd
- 2736 Kirkover Dr
- 2540 Heather Ln
- 900 Providence Rd
- 2795 Cane Mill Rd
- 2417 Lynwood Dr
- 2592 Tully Ct Unit 78
- 0 Watson Dr Unit 39
- 00 Watson Dr Unit 38
- 2697 State Road S-29-369
- 2484 Douglas Rd
- 2220 Ross Cauthen Rd
- 521 State Road S-29-757
- 2008 Hunters Ridge Rd
- 2008 Hunters Ridge Rd Unit 39
- 2000 Hunters Ridge Rd
- 2000 Hunters Ridge Rd Unit 41
- 2012 Hunters Ridge Rd
- 1894 McIlwain Rd
- 2009 Hunters Ridge Rd
- 2005 Hunters Ridge Rd
- 1907 McIlwain Rd
- 2013 Hunters Ridge Rd
- 2001 Hunters Ridge Rd
- 2020 Hunters Ridge Rd
- 2017 Hunters Ridge Rd
- 1867 McIlwain Rd
- 2021 Hunters Ridge Rd
- 1857 McIlwain Rd
- 1861 McIlwain Rd
- 1898 McIlwain Rd
- 1898 State Road S-29-158
- 1898 State Road S-29-158 Unit 11