2004 Montclair Cir Walnut Creek, CA 94597
Buena Vista Area NeighborhoodEstimated Value: $1,218,000 - $1,751,000
3
Beds
3
Baths
2,682
Sq Ft
$550/Sq Ft
Est. Value
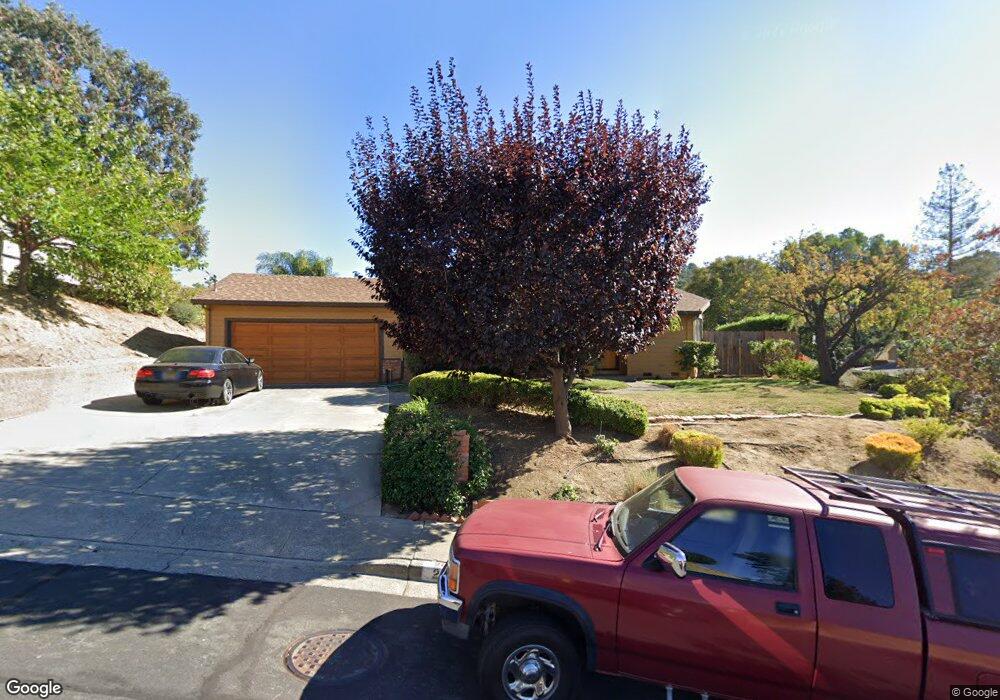
About This Home
This home is located at 2004 Montclair Cir, Walnut Creek, CA 94597 and is currently estimated at $1,475,668, approximately $550 per square foot. 2004 Montclair Cir is a home located in Contra Costa County with nearby schools including Buena Vista Elementary School, Walnut Creek Intermediate School, and Las Lomas High School.
Ownership History
Date
Name
Owned For
Owner Type
Purchase Details
Closed on
Sep 12, 2012
Sold by
Brody Mark N and Brody Mary E
Bought by
Brody Mark and Brody Mary E
Current Estimated Value
Home Financials for this Owner
Home Financials are based on the most recent Mortgage that was taken out on this home.
Original Mortgage
$392,501
Interest Rate
3.55%
Mortgage Type
New Conventional
Purchase Details
Closed on
Feb 28, 2008
Sold by
Brody Mark and Brody Mary Ellen
Bought by
Brody Mark and Brody Mary E
Purchase Details
Closed on
Mar 19, 2007
Sold by
Brody Mark and Brody Mary Ellen
Bought by
Brody Mark and Brody Mary Ellen
Home Financials for this Owner
Home Financials are based on the most recent Mortgage that was taken out on this home.
Original Mortgage
$417,000
Interest Rate
6.31%
Mortgage Type
Stand Alone Refi Refinance Of Original Loan
Create a Home Valuation Report for This Property
The Home Valuation Report is an in-depth analysis detailing your home's value as well as a comparison with similar homes in the area
Home Values in the Area
Average Home Value in this Area
Purchase History
| Date | Buyer | Sale Price | Title Company |
|---|---|---|---|
| Brody Mark | -- | Pacific Coast Title Company | |
| Brody Mark N | -- | Pacific Coast Title Company | |
| Brody Mark | -- | None Available | |
| Brody Mark | -- | Financial Title Company |
Source: Public Records
Mortgage History
| Date | Status | Borrower | Loan Amount |
|---|---|---|---|
| Closed | Brody Mark N | $392,501 | |
| Closed | Brody Mark | $417,000 |
Source: Public Records
Tax History Compared to Growth
Tax History
| Year | Tax Paid | Tax Assessment Tax Assessment Total Assessment is a certain percentage of the fair market value that is determined by local assessors to be the total taxable value of land and additions on the property. | Land | Improvement |
|---|---|---|---|---|
| 2025 | $6,726 | $521,105 | $144,174 | $376,931 |
| 2024 | $6,564 | $510,889 | $141,348 | $369,541 |
| 2023 | $6,564 | $500,873 | $138,577 | $362,296 |
| 2022 | $6,429 | $491,053 | $135,860 | $355,193 |
| 2021 | $6,254 | $481,426 | $133,197 | $348,229 |
| 2019 | $6,105 | $467,149 | $129,248 | $337,901 |
| 2018 | $5,847 | $453,088 | $126,714 | $326,374 |
| 2017 | $5,730 | $444,205 | $124,230 | $319,975 |
| 2016 | $5,611 | $435,496 | $121,795 | $313,701 |
| 2015 | $5,478 | $428,955 | $119,966 | $308,989 |
| 2014 | $5,403 | $420,554 | $117,617 | $302,937 |
Source: Public Records
Map
Nearby Homes
- 2527 Buena Vista Ave
- 2465 Buena Vista Ave
- 125 Montanya Ct
- 645 Keith Ct
- 51 Picardy Ct
- 121 School Ln
- 2616 Buenos Aires Ct
- 136 Lorie Ct
- 152 Rosemont Ct
- 1378 Cornwall Ct
- 1770 3rd Ave
- 1660 San Luis Rd
- 2660 Ross Place
- 131 Montecito Crescent
- 1475 Quail View Cir
- 1590 3rd Ave
- 2162 Hillside Ave
- 1605 Riviera Ave Unit L-608
- 955 Camino Verde Cir
- 100 Secluded Place
- 2010 Montclair Cir
- 1998 Montclair Cir
- 1992 Montclair Cir
- 2015 Alvarado Ave
- 2025 Montclair Cir
- 216 Wootten Dr
- 216 Wootten Dr Unit A
- 2019 Alvarado Ave
- 2016 Montclair Cir
- 1988 Montclair Cir
- 2022 Montclair Cir
- 2036 Alvarado Ave
- 2430 Larkey Ln
- 2033 Montclair Cir
- 2438 Larkey Ln
- 2422 Larkey Ln
- 222 Wootten Dr
- 186 Wootten Dr
- 2028 Montclair Cir
- 2448 Larkey Ln