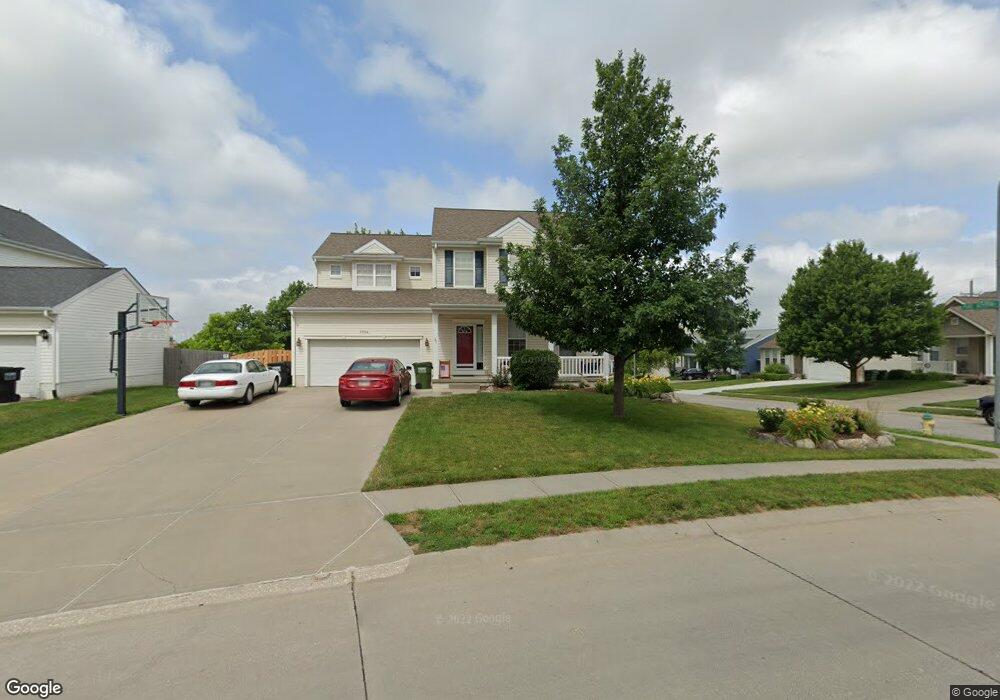
2004 Petersen Dr Papillion, NE 68046
Estimated Value: $399,000 - $452,000
4
Beds
4
Baths
3,750
Sq Ft
$113/Sq Ft
Est. Value
About This Home
This home is located at 2004 Petersen Dr, Papillion, NE 68046 and is currently estimated at $422,241, approximately $112 per square foot. 2004 Petersen Dr is a home located in Sarpy County with nearby schools including Patriot Elementary School, Liberty Middle School, and Papillion La Vista South High School.
Ownership History
Date
Name
Owned For
Owner Type
Purchase Details
Closed on
Jul 26, 2010
Sold by
Reich Loan T and Reich Joseph P
Bought by
Pitman Christopher and Pitman Holly J
Current Estimated Value
Home Financials for this Owner
Home Financials are based on the most recent Mortgage that was taken out on this home.
Original Mortgage
$206,033
Outstanding Balance
$135,583
Interest Rate
4.76%
Estimated Equity
$286,658
Purchase Details
Closed on
Apr 6, 2008
Sold by
Tinnell Phillip W and Tinnell Diana J
Bought by
Reich Loan T and Reich Joseph P
Home Financials for this Owner
Home Financials are based on the most recent Mortgage that was taken out on this home.
Original Mortgage
$225,000
Interest Rate
6.19%
Purchase Details
Closed on
Apr 1, 2005
Sold by
Hearthstone Homes Inc
Bought by
Tinnell Phillip W and Tinnell Diana J
Home Financials for this Owner
Home Financials are based on the most recent Mortgage that was taken out on this home.
Original Mortgage
$158,252
Interest Rate
5.87%
Create a Home Valuation Report for This Property
The Home Valuation Report is an in-depth analysis detailing your home's value as well as a comparison with similar homes in the area
Home Values in the Area
Average Home Value in this Area
Purchase History
We collect this data history from publicly available records. To have your information removed, we recommend requesting removal directly through your county’s website.
| Date | Buyer | Sale Price | Title Company |
|---|---|---|---|
| Pitman Christopher | $227,000 | Fnt | |
| Reich Loan T | $225,000 | Ot | |
| Tinnell Phillip W | $198,000 | -- |
Source: Public Records
Mortgage History
We collect this data history from publicly available records. To have your information removed, we recommend requesting removal directly through your county’s website.
| Date | Status | Borrower | Loan Amount |
|---|---|---|---|
| Open | Pitman Christopher | $206,033 | |
| Previous Owner | Reich Loan T | $225,000 | |
| Previous Owner | Tinnell Phillip W | $158,252 |
Source: Public Records
Tax History
| Year | Tax Paid | Tax Assessment Tax Assessment Total Assessment is a certain percentage of the fair market value that is determined by local assessors to be the total taxable value of land and additions on the property. | Land | Improvement |
|---|---|---|---|---|
| 2025 | $6,417 | $378,566 | $54,000 | $324,566 |
| 2024 | $7,081 | $370,403 | $50,000 | $320,403 |
| 2023 | $7,081 | $338,877 | $47,000 | $291,877 |
| 2022 | $6,893 | $302,466 | $42,000 | $260,466 |
| 2021 | $6,474 | $276,832 | $39,000 | $237,832 |
| 2020 | $6,226 | $266,581 | $36,000 | $230,581 |
| 2019 | $5,973 | $258,500 | $34,000 | $224,500 |
| 2018 | $5,868 | $250,930 | $32,000 | $218,930 |
| 2017 | $5,673 | $242,847 | $32,000 | $210,847 |
| 2016 | $5,519 | $234,052 | $25,000 | $209,052 |
| 2015 | $5,510 | $226,294 | $25,000 | $201,294 |
| 2014 | $5,277 | $216,025 | $25,000 | $191,025 |
| 2012 | -- | $211,904 | $25,000 | $186,904 |
Source: Public Records
Map
Nearby Homes
- 1906 Ridgeview Dr
- 1806 Walnut Creek Dr
- 1913 Southview Dr
- 1003 Valleyview Dr
- 2201 S River Rock Dr
- 2121 Glacier Dr
- 2311 Glacier Dr
- 501 Kent Dr
- 1005 Devon Dr
- 8904 Legacy St
- Lot 115 Ave Unit Lot 115
- 8815 Legacy St
- 8910 Reed St
- 12406 S 89th Ave
- 12410 S 89th Ave
- 8716 Legacy St
- 8717 Legacy St Unit Lot 71
- 8713 Legacy St Unit Lot 70
- 8706 Reed St
- 11867 S 105 Ave
- 1114 Port Royal Dr
- 1116 Port Royal Dr
- 1112 Port Royal Dr
- 1110 Port Royal Dr
- 1118 Port Royal Dr
- 2004 Diane St
- 2003 Diane St
- 1108 Port Royal Dr
- 1120 Port Royal Dr
- 1103 Edgewater Dr
- 1101 Edgewater Dr
- 2003 Walnut Creek Dr
- 2005 Diane St
- 1105 Edgewater Dr
- 1106 Port Royal Dr
- 0 Port Royal Dr
- 1013 Edgewater Dr
- 1122 Port Royal Dr
- 2008 Diane St
- 2005 Walnut Creek Dr
Your Personal Tour Guide
Ask me questions while you tour the home.