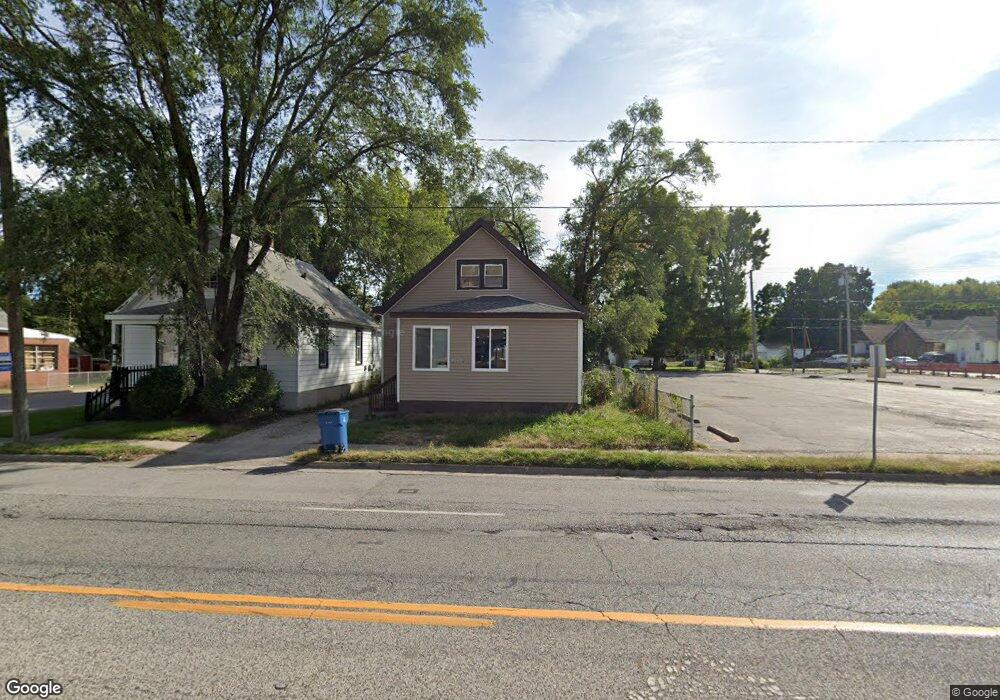
2004 S 11th St Springfield, IL 62703
Estimated Value: $32,000 - $62,000
--
Bed
--
Bath
--
Sq Ft
5,140
Sq Ft Lot
About This Home
This home is located at 2004 S 11th St, Springfield, IL 62703 and is currently estimated at $50,333. 2004 S 11th St is a home located in Sangamon County with nearby schools including Butler Elementary School, Benjamin Franklin Middle School, and Springfield Southeast High School.
Ownership History
Date
Name
Owned For
Owner Type
Purchase Details
Closed on
Dec 15, 2022
Sold by
Jj10 Properties Llc
Bought by
Sforza Andrew
Current Estimated Value
Home Financials for this Owner
Home Financials are based on the most recent Mortgage that was taken out on this home.
Original Mortgage
$331,925
Outstanding Balance
$321,965
Interest Rate
6.95%
Mortgage Type
New Conventional
Estimated Equity
-$271,632
Purchase Details
Closed on
Dec 12, 2019
Sold by
H & J Properties Incorporated
Bought by
Livein217 Llc
Home Financials for this Owner
Home Financials are based on the most recent Mortgage that was taken out on this home.
Original Mortgage
$33,400
Interest Rate
3.6%
Mortgage Type
New Conventional
Purchase Details
Closed on
Sep 26, 1996
Purchase Details
Closed on
May 31, 1994
Purchase Details
Closed on
May 23, 1994
Create a Home Valuation Report for This Property
The Home Valuation Report is an in-depth analysis detailing your home's value as well as a comparison with similar homes in the area
Home Values in the Area
Average Home Value in this Area
Purchase History
| Date | Buyer | Sale Price | Title Company |
|---|---|---|---|
| Sforza Andrew | $385,000 | -- | |
| Jj10 Properties Llc | $580,000 | -- | |
| Livein217 Llc | $14,000 | Fernandes David A | |
| -- | $20,500 | -- | |
| -- | -- | -- | |
| -- | -- | -- |
Source: Public Records
Mortgage History
| Date | Status | Borrower | Loan Amount |
|---|---|---|---|
| Open | Sforza Andrew | $331,925 | |
| Previous Owner | Livein217 Llc | $33,400 |
Source: Public Records
Tax History Compared to Growth
Tax History
| Year | Tax Paid | Tax Assessment Tax Assessment Total Assessment is a certain percentage of the fair market value that is determined by local assessors to be the total taxable value of land and additions on the property. | Land | Improvement |
|---|---|---|---|---|
| 2024 | $720 | $8,569 | $1,278 | $7,291 |
| 2023 | $692 | $7,827 | $1,167 | $6,660 |
| 2022 | $639 | $7,135 | $1,107 | $6,028 |
| 2021 | $618 | $6,868 | $1,066 | $5,802 |
| 2020 | $606 | $6,879 | $1,068 | $5,811 |
| 2019 | $817 | $9,415 | $1,063 | $8,352 |
| 2018 | $834 | $9,875 | $1,059 | $8,816 |
| 2017 | $817 | $9,747 | $1,045 | $8,702 |
| 2016 | $801 | $9,605 | $1,030 | $8,575 |
| 2015 | $793 | $9,490 | $1,018 | $8,472 |
| 2014 | $836 | $9,428 | $1,011 | $8,417 |
| 2013 | $817 | $10,089 | $1,011 | $9,078 |
Source: Public Records
Map
Nearby Homes