2004 S Oceanfront Jacksonville, FL 32250
Estimated Value: $858,000 - $1,238,000
3
Beds
3
Baths
1,631
Sq Ft
$672/Sq Ft
Est. Value
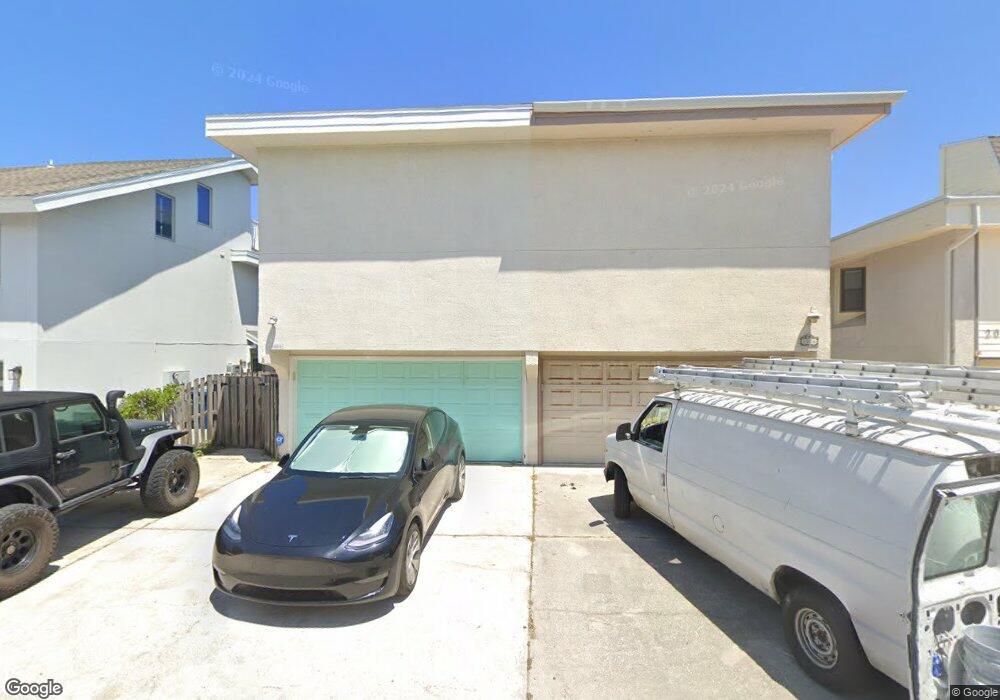
About This Home
This home is located at 2004 S Oceanfront, Jacksonville, FL 32250 and is currently estimated at $1,095,739, approximately $671 per square foot. 2004 S Oceanfront is a home located in Duval County with nearby schools including Seabreeze Elementary School, Duncan U. Fletcher Middle School, and Duncan U. Fletcher High School.
Ownership History
Date
Name
Owned For
Owner Type
Purchase Details
Closed on
Aug 29, 2018
Sold by
Ssi Properties Inc
Bought by
Beierschmitt John J and Beierschmitt Karen T
Current Estimated Value
Purchase Details
Closed on
Jun 22, 2018
Sold by
Jason Richard S and Jason Helen E
Bought by
Ssi Properties Inc
Home Financials for this Owner
Home Financials are based on the most recent Mortgage that was taken out on this home.
Original Mortgage
$520,000
Interest Rate
5.5%
Mortgage Type
Adjustable Rate Mortgage/ARM
Purchase Details
Closed on
Mar 17, 1995
Sold by
Faucher Paul G and Faucher Mildred K
Bought by
Jason Richard S and Jason Truly M
Home Financials for this Owner
Home Financials are based on the most recent Mortgage that was taken out on this home.
Original Mortgage
$106,440
Interest Rate
8.86%
Create a Home Valuation Report for This Property
The Home Valuation Report is an in-depth analysis detailing your home's value as well as a comparison with similar homes in the area
Home Values in the Area
Average Home Value in this Area
Purchase History
| Date | Buyer | Sale Price | Title Company |
|---|---|---|---|
| Beierschmitt John J | -- | Accommodation/Courtesy Recordi | |
| Beierschmitt John J | -- | Attorney | |
| Ssi Properties Inc | $650,000 | Attorney | |
| Jason Richard S | $130,000 | -- |
Source: Public Records
Mortgage History
| Date | Status | Borrower | Loan Amount |
|---|---|---|---|
| Previous Owner | Ssi Properties Inc | $520,000 | |
| Previous Owner | Jason Richard S | $106,440 |
Source: Public Records
Tax History Compared to Growth
Tax History
| Year | Tax Paid | Tax Assessment Tax Assessment Total Assessment is a certain percentage of the fair market value that is determined by local assessors to be the total taxable value of land and additions on the property. | Land | Improvement |
|---|---|---|---|---|
| 2025 | $15,781 | $800,153 | -- | -- |
| 2024 | $13,205 | $1,086,041 | $872,100 | $213,941 |
| 2023 | $13,205 | $795,851 | $587,520 | $208,331 |
| 2022 | $11,477 | $749,915 | $550,800 | $199,115 |
| 2021 | $9,949 | $546,517 | $385,560 | $160,957 |
| 2020 | $9,899 | $540,611 | $385,560 | $155,051 |
| 2019 | $10,037 | $540,520 | $385,560 | $154,960 |
| 2018 | $5,409 | $330,425 | $0 | $0 |
| 2017 | $5,343 | $323,629 | $0 | $0 |
| 2016 | $6,752 | $354,084 | $0 | $0 |
| 2015 | $6,389 | $327,711 | $0 | $0 |
| 2014 | $6,287 | $317,509 | $0 | $0 |
Source: Public Records
Map
Nearby Homes
- 2200 Ocean Dr S Unit 5C
- 2211 1st St S
- 2002 1st St S
- 2223 2225 1st St S Unit 1 2 3 4
- 2149 2nd St S
- 1827 1st St S
- 1819 Ocean Dr S
- 2272 2nd St S
- 2088 Gail Ave
- 200 Laguna Villa Blvd Unit C-21
- 1717 2nd St S
- 202 Laguna Villa Blvd Unit B24
- 103 25th Ave S Unit K32
- 204 Laguna Villa Blvd Unit A11
- 1601 Ocean Dr S Unit 1003
- 1601 Ocean Dr S Unit 401
- 1601 Ocean Dr S Unit 104
- 1601 Ocean Dr S Unit 408
- 1601 Ocean Dr S Unit 505
- 1601 Ocean Dr S Unit 701
- 2004 Ocean Front S
- 2004 Ocean Dr S
- 2004 Ocean Dr S
- 2006 Ocean Dr S
- 2002 Ocean Front S
- 2008 Ocean Dr S
- 2008 Ocean Dr S
- 2010 Ocean Front S
- 2012 Ocean Front S
- 2 20th Ave S
- 2014 Ocean Front S
- 1 21st Ave S
- 1 21st Ave S Unit B
- 4 20th Ave S Unit LOWER UNIT
- 4 20th Ave S Unit 4
- 4 20th Ave S
- 4 20th Ave S Unit STUDIO
- 3 21st Ave S
- 6 20th Ave S
- 5 21st Ave S