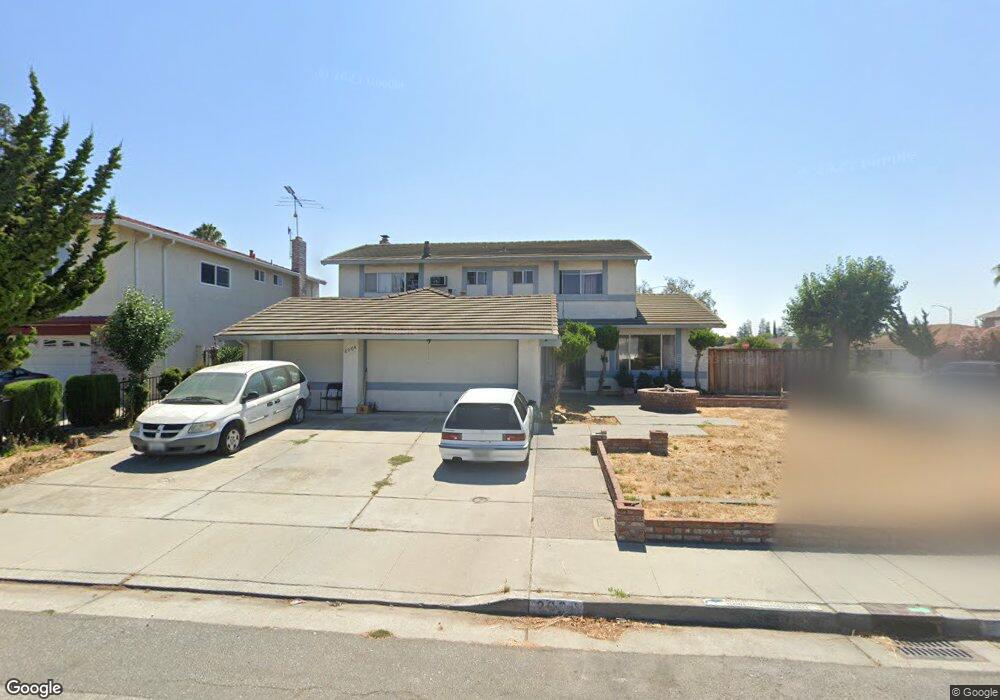
2004 Shellback Place San Jose, CA 95133
Commodore NeighborhoodEstimated Value: $1,736,210 - $1,996,000
5
Beds
3
Baths
2,533
Sq Ft
$732/Sq Ft
Est. Value
About This Home
This home is located at 2004 Shellback Place, San Jose, CA 95133 and is currently estimated at $1,854,053, approximately $731 per square foot. 2004 Shellback Place is a home located in Santa Clara County with nearby schools including Vinci Park Elementary School, Piedmont Middle School, and Independence High School.
Ownership History
Date
Name
Owned For
Owner Type
Purchase Details
Closed on
May 31, 2017
Sold by
Gabriel Orlando A and Gabriel Beth A
Bought by
Gabriel Orlando A and Gabriel Beth A
Current Estimated Value
Purchase Details
Closed on
Aug 24, 2000
Sold by
Rodriguez Victor and Rodriguez Virginia
Bought by
Gabriel Orlando A and Gabriel Beth A
Home Financials for this Owner
Home Financials are based on the most recent Mortgage that was taken out on this home.
Original Mortgage
$260,000
Outstanding Balance
$94,140
Interest Rate
8.2%
Estimated Equity
$1,759,913
Purchase Details
Closed on
Mar 6, 2000
Sold by
Virginia Rodriguez
Bought by
Rodriguez Victoriano and Rodriguez Virginia
Purchase Details
Closed on
Mar 23, 1995
Sold by
Rodriguez Victoriano
Bought by
Rodriguez Victoriano and Rodriguez Virginia
Home Financials for this Owner
Home Financials are based on the most recent Mortgage that was taken out on this home.
Original Mortgage
$60,000
Interest Rate
8.6%
Purchase Details
Closed on
Oct 7, 1993
Sold by
Valencia Alma G
Bought by
Valencia Daniel and Valencia Efrain
Create a Home Valuation Report for This Property
The Home Valuation Report is an in-depth analysis detailing your home's value as well as a comparison with similar homes in the area
Home Values in the Area
Average Home Value in this Area
Purchase History
| Date | Buyer | Sale Price | Title Company |
|---|---|---|---|
| Gabriel Orlando A | -- | None Available | |
| Gabriel Orlando A | $595,000 | Old Republic Title Company | |
| Rodriguez Victoriano | -- | -- | |
| Rodriguez Victoriano | -- | Golden California Title Co | |
| Valencia Daniel | -- | -- |
Source: Public Records
Mortgage History
| Date | Status | Borrower | Loan Amount |
|---|---|---|---|
| Open | Gabriel Orlando A | $260,000 | |
| Previous Owner | Rodriguez Victoriano | $60,000 |
Source: Public Records
Tax History
| Year | Tax Paid | Tax Assessment Tax Assessment Total Assessment is a certain percentage of the fair market value that is determined by local assessors to be the total taxable value of land and additions on the property. | Land | Improvement |
|---|---|---|---|---|
| 2025 | $13,339 | $896,550 | $358,617 | $537,933 |
| 2024 | $13,339 | $878,972 | $351,586 | $527,386 |
| 2023 | $13,095 | $861,739 | $344,693 | $517,046 |
| 2022 | $13,013 | $844,843 | $337,935 | $506,908 |
| 2021 | $12,576 | $828,278 | $331,309 | $496,969 |
| 2020 | $12,136 | $819,786 | $327,912 | $491,874 |
| 2019 | $11,654 | $803,713 | $321,483 | $482,230 |
| 2018 | $11,478 | $787,955 | $315,180 | $472,775 |
| 2017 | $11,540 | $772,505 | $309,000 | $463,505 |
| 2016 | $11,069 | $757,359 | $302,942 | $454,417 |
| 2015 | $10,949 | $745,984 | $298,392 | $447,592 |
| 2014 | $9,729 | $731,372 | $292,547 | $438,825 |
Source: Public Records
Map
Nearby Homes
- 2043 Shellback Place
- 2083 Bluejacket Way
- 1034 Ribisi Cir
- 1135 Pandolfi Place
- 1136 Ribisi Cir
- 12280 Mabury Rd
- 783 Opie Ct
- 2381 Lava Dr
- 2194 Celeste Ct
- 1682 Commodore Dr
- 879 Wyman Way Unit 2
- 2505 Dillion Ct Unit 3
- 1967 Nevets Ln
- 1729 Maysong Ct
- 1131 Chen St
- 1901 Nevets Ln
- 1252 Turrett Dr
- 688 Squire Ave
- 1985 Mahuron Cir
- 1965 Mahuron Cir
- 2012 Shellback Place
- 2007 Commodore Dr
- 2015 Commodore Dr
- 2018 Shellback Place
- 2003 Shellback Place
- 2011 Shellback Place
- 2023 Commodore Dr
- 973 Branbury Way
- 979 Branbury Way
- 2028 Shellback Place
- 967 Branbury Way
- 2019 Shellback Place
- 985 Branbury Way
- 961 Branbury Way
- 2031 Commodore Dr
- 991 Branbury Way
- 2027 Shellback Place
- 2004 Bluejacket Way
- 2034 Shellback Place
- 2012 Bluejacket Way
Your Personal Tour Guide
Ask me questions while you tour the home.