Estimated Value: $565,000 - $586,477
3
Beds
2
Baths
2,416
Sq Ft
$238/Sq Ft
Est. Value
About This Home
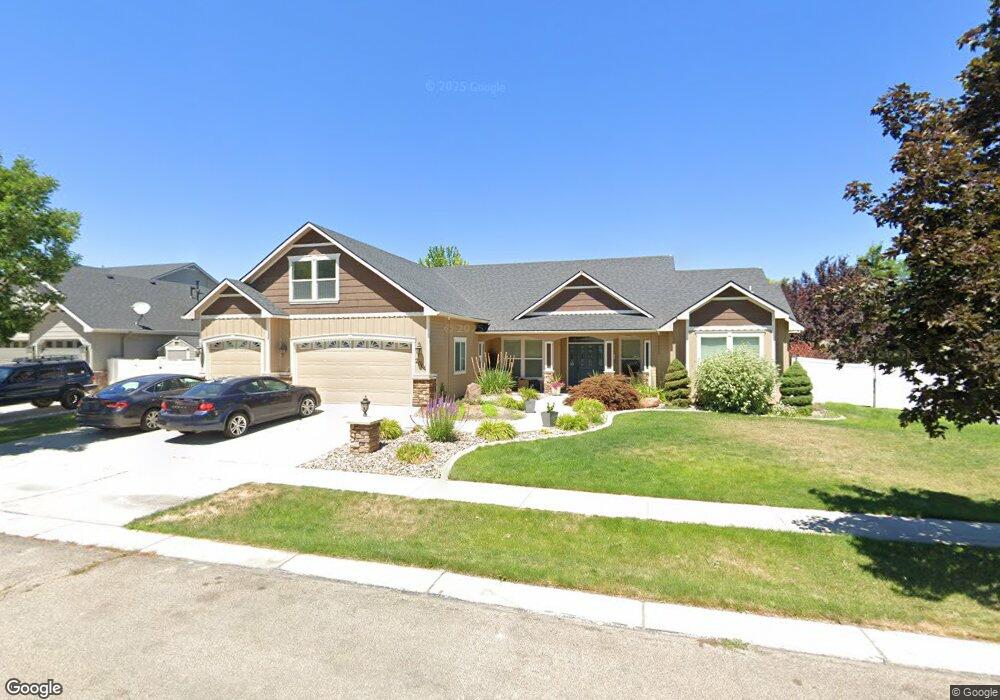
This home is located at 2004 W Cross Creek Dr, Nampa, ID 83686 and is currently estimated at $576,119, approximately $238 per square foot. 2004 W Cross Creek Dr is a home located in Canyon County with nearby schools including Owyhee Elementary School, Lone Star Middle School, and Nampa Senior High School.
Ownership History
Date
Name
Owned For
Owner Type
Purchase Details
Closed on
Oct 13, 2006
Sold by
Cotner Building Co Llc
Bought by
Cotner Building Co Llc and Thompson Todd C
Current Estimated Value
Home Financials for this Owner
Home Financials are based on the most recent Mortgage that was taken out on this home.
Original Mortgage
$259,200
Outstanding Balance
$154,213
Interest Rate
6.5%
Mortgage Type
Purchase Money Mortgage
Estimated Equity
$421,906
Purchase Details
Closed on
Sep 22, 2006
Sold by
Cotner Building Co Llc
Bought by
Thompson Todd C and Thompson Sarah E
Home Financials for this Owner
Home Financials are based on the most recent Mortgage that was taken out on this home.
Original Mortgage
$259,200
Outstanding Balance
$154,213
Interest Rate
6.5%
Mortgage Type
Purchase Money Mortgage
Estimated Equity
$421,906
Purchase Details
Closed on
Sep 1, 2004
Sold by
Skc Inc
Bought by
Cotner Building Co Llc
Create a Home Valuation Report for This Property
The Home Valuation Report is an in-depth analysis detailing your home's value as well as a comparison with similar homes in the area
Home Values in the Area
Average Home Value in this Area
Purchase History
| Date | Buyer | Sale Price | Title Company |
|---|---|---|---|
| Cotner Building Co Llc | -- | Accommodation | |
| Thompson Todd C | -- | Transnation Title | |
| Cotner Building Co Llc | -- | Title One |
Source: Public Records
Mortgage History
| Date | Status | Borrower | Loan Amount |
|---|---|---|---|
| Open | Thompson Todd C | $259,200 |
Source: Public Records
Tax History Compared to Growth
Tax History
| Year | Tax Paid | Tax Assessment Tax Assessment Total Assessment is a certain percentage of the fair market value that is determined by local assessors to be the total taxable value of land and additions on the property. | Land | Improvement |
|---|---|---|---|---|
| 2025 | $2,641 | $548,800 | $139,400 | $409,400 |
| 2024 | $2,641 | $551,500 | $139,400 | $412,100 |
| 2023 | $2,337 | $518,400 | $139,400 | $379,000 |
| 2022 | $3,246 | $564,800 | $167,200 | $397,600 |
| 2021 | $3,226 | $398,800 | $91,000 | $307,800 |
| 2020 | $2,875 | $322,000 | $70,000 | $252,000 |
| 2019 | $3,291 | $305,100 | $58,500 | $246,600 |
| 2018 | $3,164 | $0 | $0 | $0 |
| 2017 | $3,093 | $0 | $0 | $0 |
| 2016 | $2,880 | $0 | $0 | $0 |
| 2015 | $2,918 | $0 | $0 | $0 |
| 2014 | $3,003 | $238,000 | $45,500 | $192,500 |
Source: Public Records
Map
Nearby Homes
- 2005 W Moose Creek Dr
- 2108 W Silver Creek Dr
- 1011 S River Stone Dr
- 706 S Lancaster Dr
- 2310 W Herron Loop
- 722 S Bonneville Dr
- 1624 S Miller Way
- 11300 Lake Lowell Ave
- TBD Lake Lowell Ave
- 1408 Lake Lowell Ave
- 2520 W Mill Ct
- 1605 S Boundary St
- Residence 16 Plan at Sagewater
- Residence 15 Plan at Sagewater
- Residence 14 Plan at Sagewater
- Residence 13 Plan at Sagewater
- 1239 Willow Creek Dr
- 595 S Alyssa Ave
- 1300 Lake Lowell Ave
- 11150 W Troyer Dr
- 1922 W Bear Creek Dr
- 1927 W Bear Creek Dr
- 1941 W Moose Creek Dr
- 2024 W Cross Creek Dr
- 2003 W Cross Creek Dr
- 1941 W Bear Creek Dr
- 2013 W Cross Creek Dr
- 1912 W Bear Creek Dr
- 1929 W Moose Creek Dr
- 2023 W Cross Creek Dr
- 1961 W Bear Creek Dr
- 2044 W Cross Creek Dr
- 1115 S Whitewater Dr
- 1139 S Whitewater Dr
- 1027 S Whitewater Dr
- 2019 W Moose Creek Dr
- 1917 W Moose Creek Dr
- 2043 W Cross Creek Dr
- 2014 W Bear Creek Dr
- 1209 S Whitewater Dr