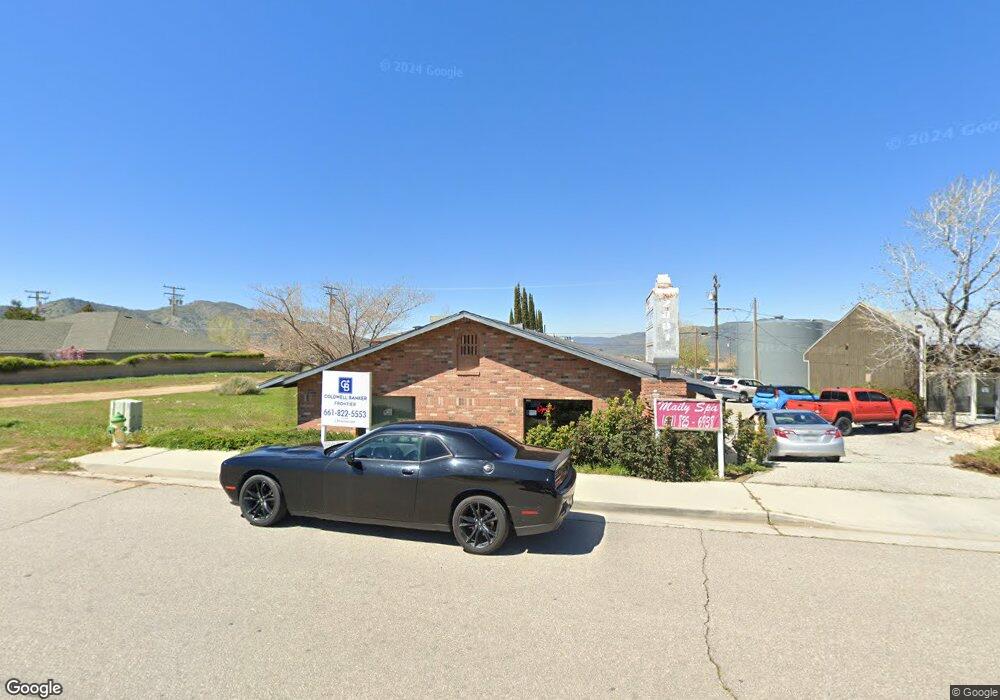
20041 W Valley Blvd Unit 1 Tehachapi, CA 93561
Estimated Value: $474,094
2
Beds
1
Bath
867
Sq Ft
$547/Sq Ft
Est. Value
About This Home
This home is located at 20041 W Valley Blvd Unit 1, Tehachapi, CA 93561 and is currently estimated at $474,094, approximately $546 per square foot. 20041 W Valley Blvd Unit 1 is a home located in Kern County with nearby schools including Golden Hills Elementary School, Jacobsen Middle School, and Tehachapi High School.
Ownership History
Date
Name
Owned For
Owner Type
Purchase Details
Closed on
Dec 16, 2024
Sold by
Dirt Road Estates Llc
Bought by
Rg Smith Enterprises Llc
Current Estimated Value
Home Financials for this Owner
Home Financials are based on the most recent Mortgage that was taken out on this home.
Original Mortgage
$380,000
Outstanding Balance
$377,040
Interest Rate
6.84%
Mortgage Type
Seller Take Back
Estimated Equity
$97,054
Purchase Details
Closed on
Apr 10, 2003
Sold by
Flanagan Michael J and Flanagan Sharon P
Bought by
Dirt Road Estates Llc
Purchase Details
Closed on
Dec 9, 2002
Sold by
Deutchman Ronald and Cohen Sherri
Bought by
Flanagan Michael J
Purchase Details
Closed on
Oct 26, 1994
Sold by
Ozenne Mary E and Deutchman Victor H
Bought by
Deutchman Victor H and Deutchman Lola Y
Create a Home Valuation Report for This Property
The Home Valuation Report is an in-depth analysis detailing your home's value as well as a comparison with similar homes in the area
Home Values in the Area
Average Home Value in this Area
Purchase History
| Date | Buyer | Sale Price | Title Company |
|---|---|---|---|
| Rg Smith Enterprises Llc | $475,000 | Chicago Title Company | |
| Rg Smith Enterprises Llc | $475,000 | Chicago Title Company | |
| Dirt Road Estates Llc | -- | -- | |
| Flanagan Michael J | $205,000 | Chicago Title | |
| Deutchman Victor H | $500 | -- |
Source: Public Records
Mortgage History
| Date | Status | Borrower | Loan Amount |
|---|---|---|---|
| Open | Rg Smith Enterprises Llc | $380,000 | |
| Closed | Rg Smith Enterprises Llc | $380,000 |
Source: Public Records
Tax History
| Year | Tax Paid | Tax Assessment Tax Assessment Total Assessment is a certain percentage of the fair market value that is determined by local assessors to be the total taxable value of land and additions on the property. | Land | Improvement |
|---|---|---|---|---|
| 2025 | $3,380 | $296,737 | $48,651 | $248,086 |
| 2024 | $3,380 | $290,920 | $47,698 | $243,222 |
| 2023 | $3,262 | $285,216 | $46,763 | $238,453 |
| 2022 | $3,240 | $279,625 | $45,847 | $233,778 |
| 2021 | $3,262 | $274,144 | $44,949 | $229,195 |
| 2020 | $3,298 | $271,334 | $44,489 | $226,845 |
| 2019 | $3,298 | $271,334 | $44,489 | $226,845 |
| 2018 | $3,178 | $260,800 | $42,762 | $218,038 |
| 2017 | $3,174 | $255,687 | $41,924 | $213,763 |
| 2016 | $3,087 | $250,674 | $41,102 | $209,572 |
| 2015 | $2,932 | $246,910 | $40,485 | $206,425 |
| 2014 | $2,900 | $242,074 | $39,692 | $202,382 |
Source: Public Records
Map
Nearby Homes
- 21110 Santa Maria Dr
- 21247 Madre St
- 21301 Golden Hills Blvd
- 21461 Silver Dr
- 0 Valley Blvd Unit SR24022091
- 0 Valley Blvd Unit SR24022045
- 0 Valley Blvd Unit SR24022026
- 0 Valley Blvd Unit SR24022038
- 21504 Golden Hills Blvd
- 21613 Loop
- 21510 Shirley Dr
- 21621 Golden Hills Blvd
- 0 Vl 377-170-39 Unit 26000082
- 21653 Golden Hills Blvd
- 21601 Westwood Blvd
- 21730 Ripple Ln
- 0 Abajo Ave
- 0 Apn#325-102-02 Unit SR25198886
- 1 Valley Blvd
- 21258 Jeffery Rd
- 20041 W Valley Blvd
- 20041 Valley Blvd
- 20031 W Valley Blvd
- 20101 Valley Blvd
- 21031 Santa Barbara Dr
- 20111 Valley Blvd
- 20121 W Cummings Valley Blvd
- 21035 Santa Barbara Dr
- 21039 Santa Barbara Dr
- 20150 W Valley Blvd
- 21043 Santa Barbara Dr
- 21101 Santa Maria Dr
- 21036 Santa Barbara Dr Unit B1
- 21036 Santa Barbara Dr Unit A1
- 21036 Santa Barbara Dr
- 21100 Santa Maria Dr
- 21047 Santa Barbara Dr
- 21032 Santa Barbara Dr
- 21040 Santa Barbara Dr
- 21051 Santa Barbara Dr Unit A-D
Your Personal Tour Guide
Ask me questions while you tour the home.