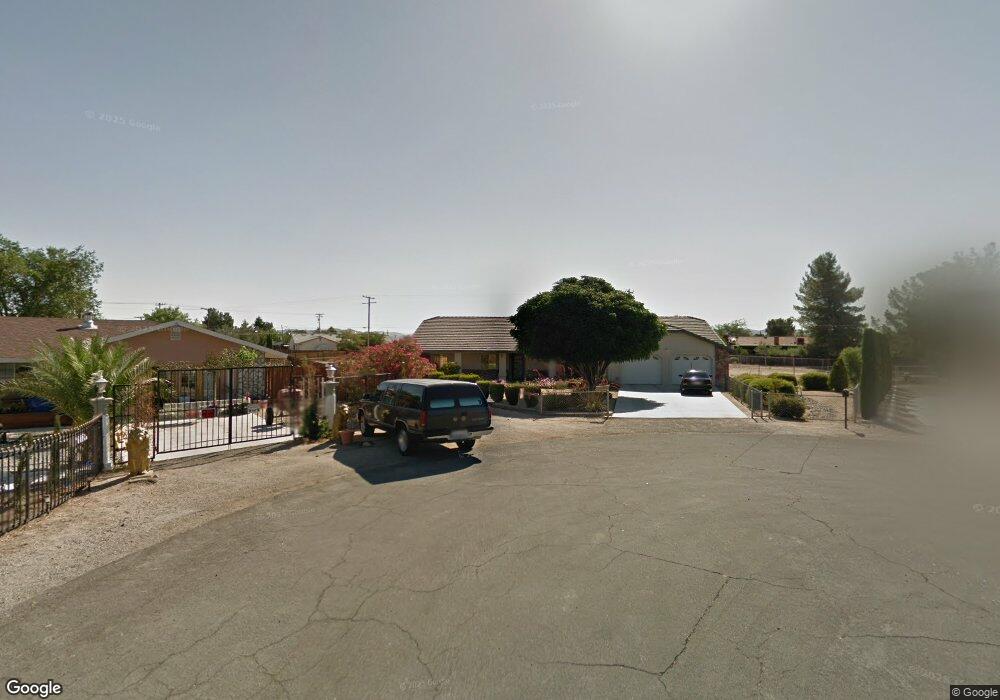
20042 Cronese Ln Apple Valley, CA 92308
High Desert NeighborhoodEstimated Value: $388,000 - $454,000
3
Beds
2
Baths
1,455
Sq Ft
$293/Sq Ft
Est. Value
About This Home
This home is located at 20042 Cronese Ln, Apple Valley, CA 92308 and is currently estimated at $425,635, approximately $292 per square foot. 20042 Cronese Ln is a home located in San Bernardino County with nearby schools including Sitting Bull Academy, Apple Valley High School, and Apple Valley Christian.
Ownership History
Date
Name
Owned For
Owner Type
Purchase Details
Closed on
Oct 29, 2021
Sold by
Torres Salvador and Torres Guadalupe R
Bought by
Torres Salvador and Torres Guadalupe R
Current Estimated Value
Home Financials for this Owner
Home Financials are based on the most recent Mortgage that was taken out on this home.
Original Mortgage
$200,300
Outstanding Balance
$183,591
Interest Rate
3.01%
Mortgage Type
New Conventional
Estimated Equity
$242,044
Purchase Details
Closed on
Apr 9, 2019
Sold by
Paul V Reeves and Paul Nancy D Reeves Rlt
Bought by
Torres Salvador and Torres Guadalupe R
Home Financials for this Owner
Home Financials are based on the most recent Mortgage that was taken out on this home.
Original Mortgage
$200,000
Interest Rate
4%
Mortgage Type
New Conventional
Purchase Details
Closed on
Nov 1, 2001
Sold by
Reeves Paul V
Bought by
Reeves Paul V and Reeves Nancy D
Purchase Details
Closed on
Apr 16, 1997
Sold by
Dunagan Edward A and Dunagan Cheryl A
Bought by
Reeves Paul V and Reeves Nancy D
Create a Home Valuation Report for This Property
The Home Valuation Report is an in-depth analysis detailing your home's value as well as a comparison with similar homes in the area
Home Values in the Area
Average Home Value in this Area
Purchase History
| Date | Buyer | Sale Price | Title Company |
|---|---|---|---|
| Torres Salvador | -- | Accommodation | |
| Torres Salvador | $250,000 | Chicago Title Company | |
| Reeves Paul V | -- | -- | |
| Reeves Paul V | $116,500 | Fidelity National Title Ins |
Source: Public Records
Mortgage History
| Date | Status | Borrower | Loan Amount |
|---|---|---|---|
| Open | Torres Salvador | $200,300 | |
| Closed | Torres Salvador | $200,000 |
Source: Public Records
Tax History
| Year | Tax Paid | Tax Assessment Tax Assessment Total Assessment is a certain percentage of the fair market value that is determined by local assessors to be the total taxable value of land and additions on the property. | Land | Improvement |
|---|---|---|---|---|
| 2025 | $3,608 | $313,266 | $72,920 | $240,346 |
| 2024 | $3,504 | $307,123 | $71,490 | $235,633 |
| 2023 | $3,471 | $301,101 | $70,088 | $231,013 |
| 2022 | $3,491 | $295,197 | $68,714 | $226,483 |
| 2021 | $2,981 | $257,642 | $61,834 | $195,808 |
| 2020 | $2,944 | $255,000 | $61,200 | $193,800 |
| 2019 | $2,962 | $166,041 | $42,941 | $123,100 |
| 2018 | $1,893 | $162,785 | $42,099 | $120,686 |
| 2017 | $1,865 | $159,594 | $41,274 | $118,320 |
| 2016 | $1,774 | $156,465 | $40,465 | $116,000 |
| 2015 | $1,746 | $154,115 | $39,857 | $114,258 |
| 2014 | $1,722 | $151,096 | $39,076 | $112,020 |
Source: Public Records
Map
Nearby Homes
- 19924 Sunset Ln
- 13519 Sunset Dr
- 19898 Sunset Ln
- 19978 Eyota Rd
- 13809 Titonka Rd
- 13934 Okesa Rd
- 19783 Lara Ln
- 20136 Ottawa Rd
- 13954 Cronese Rd
- 13311 Choco Rd
- 14024 Delaware Rd
- 14057 Crow Rd
- 13288 Choco Rd
- 13564 Seminole Rd
- 13167 Olathe Rd
- 0 Shawnee Rd Unit HD25098149
- 13991 Falling Leaf Rd
- 19891 Talihina Rd
- 20190 Osseo Rd
- 14127 Crow Rd
- 20034 Cronese Ln
- 20035 Cronese Ln
- 13632 Rincon Rd
- 20055 Yucca Loma Rd
- 20033 Yucca Loma Rd
- 20014 Cronese Ln
- 20058 Itasca Rd
- 20081 Yucca Loma Rd
- 13604 Rincon Rd
- 20015 Cronese Ln
- 20038 Itasca Rd
- 20011 Yucca Loma Rd
- 0 Itasca Rd
- 13659 Rincon Rd
- 13635 Rincon Rd
- 13651 Cronese Rd
- 20016 Itasca Rd
- 19989 Cronese Ln
- 13695 Rincon Rd
Your Personal Tour Guide
Ask me questions while you tour the home.