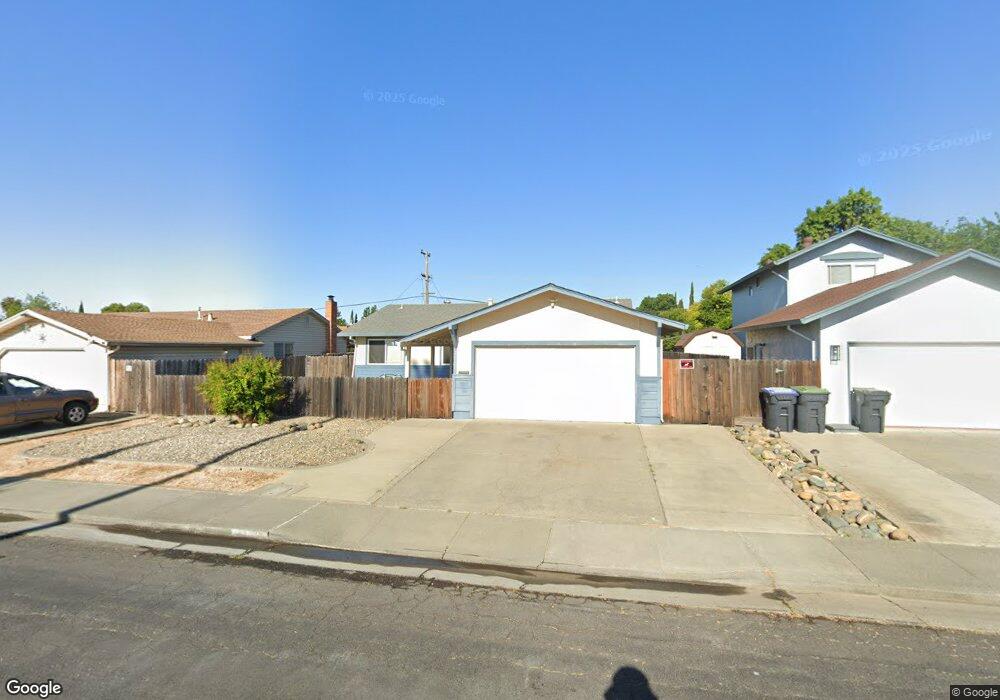
2005 Bluebird Way Fairfield, CA 94533
Estimated Value: $431,000 - $496,000
3
Beds
2
Baths
1,300
Sq Ft
$359/Sq Ft
Est. Value
About This Home
This home is located at 2005 Bluebird Way, Fairfield, CA 94533 and is currently estimated at $466,973, approximately $359 per square foot. 2005 Bluebird Way is a home located in Solano County with nearby schools including Cleo Gordon Elementary School, Grange Middle School, and Fairfield High School.
Ownership History
Date
Name
Owned For
Owner Type
Purchase Details
Closed on
Oct 22, 2009
Sold by
Blue Mountain Mortgage Llc
Bought by
Medrano Kaleb A and Medrano Jessica I
Current Estimated Value
Home Financials for this Owner
Home Financials are based on the most recent Mortgage that was taken out on this home.
Original Mortgage
$171,000
Outstanding Balance
$111,203
Interest Rate
5%
Mortgage Type
VA
Estimated Equity
$355,770
Purchase Details
Closed on
Jun 30, 2009
Sold by
Brooks Linda Kay and Brooks Earl
Bought by
Blue Mountain Mortgage Llc
Purchase Details
Closed on
Dec 7, 2005
Sold by
Evans Callie J and Evans Robert S
Bought by
Brooks Earl and Brooks Linda Kay
Home Financials for this Owner
Home Financials are based on the most recent Mortgage that was taken out on this home.
Original Mortgage
$256,800
Interest Rate
7.5%
Mortgage Type
Purchase Money Mortgage
Create a Home Valuation Report for This Property
The Home Valuation Report is an in-depth analysis detailing your home's value as well as a comparison with similar homes in the area
Home Values in the Area
Average Home Value in this Area
Purchase History
| Date | Buyer | Sale Price | Title Company |
|---|---|---|---|
| Medrano Kaleb A | $171,000 | Placer Title Company | |
| Blue Mountain Mortgage Llc | $95,100 | None Available | |
| Brooks Earl | $321,000 | Chicago Title Co |
Source: Public Records
Mortgage History
| Date | Status | Borrower | Loan Amount |
|---|---|---|---|
| Open | Medrano Kaleb A | $171,000 | |
| Previous Owner | Brooks Earl | $256,800 |
Source: Public Records
Tax History
| Year | Tax Paid | Tax Assessment Tax Assessment Total Assessment is a certain percentage of the fair market value that is determined by local assessors to be the total taxable value of land and additions on the property. | Land | Improvement |
|---|---|---|---|---|
| 2025 | $2,483 | $220,718 | $51,627 | $169,091 |
| 2024 | $2,483 | $216,391 | $50,615 | $165,776 |
| 2023 | $2,407 | $212,149 | $49,623 | $162,526 |
| 2022 | $2,378 | $207,990 | $48,650 | $159,340 |
| 2021 | $2,355 | $203,913 | $47,697 | $156,216 |
| 2020 | $2,300 | $201,823 | $47,208 | $154,615 |
| 2019 | $2,244 | $197,867 | $46,283 | $151,584 |
| 2018 | $2,316 | $193,988 | $45,376 | $148,612 |
| 2017 | $2,209 | $190,186 | $44,487 | $145,699 |
| 2016 | $2,188 | $186,458 | $43,615 | $142,843 |
| 2015 | $2,043 | $183,658 | $42,960 | $140,698 |
| 2014 | $2,024 | $180,061 | $42,119 | $137,942 |
Source: Public Records
Map
Nearby Homes
- 849 Finch Way
- 2049 Swan Way
- 237 Del Loma Ct
- 68 El Toro Ct
- 217 Del Luz Ct
- 175 Del Sur Ct
- 2275 Dover Ave
- 50 El Basset Ct Unit 1
- 2219 Santa Clara Dr
- 2386 Baltic Ct
- 2373 Dawn Way
- 400 Santa Maria Dr
- 1850 San Juan St
- 2429 Baltic Dr
- 2013 Cormorant Dr
- 2202 Sandpiper Dr
- 1850 Blossom Ave Unit 115
- 1941 Grande Cir Unit 45
- 1941 Grande Cir Unit 48
- 1941 Grande Cir Unit 71
- 2009 Bluebird Way
- 2001 Bluebird Way
- 2010 Thrush Way
- 2016 Thrush Way
- 2004 Thrush Way
- 2015 Bluebird Way
- 2000 Bluebird Way
- 2006 Bluebird Way
- 2022 Thrush Way
- 2017 Bluebird Way
- 2012 Bluebird Way
- 831 Meadowlark Dr
- 837 Meadowlark Dr
- 2028 Thrush Way
- 843 Meadowlark Dr
- 825 Meadowlark Dr
- 849 Meadowlark Dr
- 2016 Bluebird Way
- 2021 Bluebird Way
- 2009 Thrush Way
Your Personal Tour Guide
Ask me questions while you tour the home.