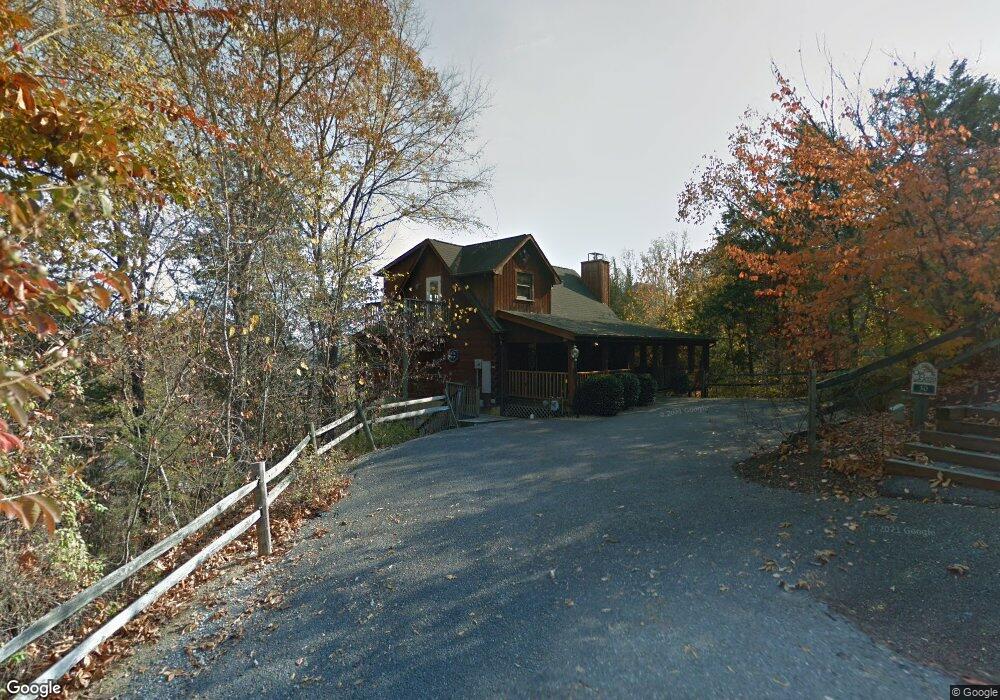
2005 Destiny Way Sevierville, TN 37876
Estimated Value: $433,016
--
Bed
2
Baths
1,200
Sq Ft
$361/Sq Ft
Est. Value
About This Home
This home is located at 2005 Destiny Way, Sevierville, TN 37876 and is currently estimated at $433,016, approximately $360 per square foot. 2005 Destiny Way is a home located in Sevier County with nearby schools including Northview Elementary School, Catons Chapel Elementary School, and Jones Cove Elementary School.
Ownership History
Date
Name
Owned For
Owner Type
Purchase Details
Closed on
Jan 6, 2020
Sold by
Beaird Lori D
Bought by
Andrews John E and Andrews Janie M
Current Estimated Value
Home Financials for this Owner
Home Financials are based on the most recent Mortgage that was taken out on this home.
Original Mortgage
$269,910
Outstanding Balance
$238,476
Interest Rate
3.6%
Mortgage Type
New Conventional
Estimated Equity
$194,540
Purchase Details
Closed on
Jun 12, 2008
Sold by
Normand James A
Bought by
Todd Beaird James
Home Financials for this Owner
Home Financials are based on the most recent Mortgage that was taken out on this home.
Original Mortgage
$250,200
Interest Rate
5.97%
Purchase Details
Closed on
Feb 10, 1999
Sold by
Normand James A
Bought by
David Eledge
Purchase Details
Closed on
Dec 3, 1996
Sold by
Mccarter Chuck B
Bought by
Narmand James A and Narmand Elizabet
Create a Home Valuation Report for This Property
The Home Valuation Report is an in-depth analysis detailing your home's value as well as a comparison with similar homes in the area
Home Values in the Area
Average Home Value in this Area
Purchase History
| Date | Buyer | Sale Price | Title Company |
|---|---|---|---|
| Andrews John E | $299,900 | Property Title Services Llc | |
| Todd Beaird James | $278,000 | -- | |
| David Eledge | $40,000 | -- | |
| Narmand James A | $38,000 | -- |
Source: Public Records
Mortgage History
| Date | Status | Borrower | Loan Amount |
|---|---|---|---|
| Open | Andrews John E | $269,910 | |
| Previous Owner | Narmand James A | $250,200 | |
| Previous Owner | Narmand James A | $45,000 |
Source: Public Records
Tax History Compared to Growth
Tax History
| Year | Tax Paid | Tax Assessment Tax Assessment Total Assessment is a certain percentage of the fair market value that is determined by local assessors to be the total taxable value of land and additions on the property. | Land | Improvement |
|---|---|---|---|---|
| 2025 | $3,434 | $116,040 | $21,600 | $94,440 |
| 2024 | $3,434 | $116,040 | $21,600 | $94,440 |
| 2023 | $3,434 | $116,040 | $0 | $0 |
| 2022 | $1,382 | $72,525 | $13,500 | $59,025 |
| 2021 | $1,382 | $72,525 | $13,500 | $59,025 |
| 2020 | $1,051 | $72,525 | $13,500 | $59,025 |
| 2019 | $1,051 | $44,575 | $13,500 | $31,075 |
| 2018 | $1,051 | $44,575 | $13,500 | $31,075 |
| 2017 | $1,051 | $44,575 | $13,500 | $31,075 |
| 2016 | $967 | $44,575 | $13,500 | $31,075 |
| 2015 | -- | $45,925 | $0 | $0 |
| 2014 | $891 | $45,936 | $0 | $0 |
Source: Public Records
Map
Nearby Homes
- 1371 Lake Haven Way
- 320 Oak Haven Way
- 2040 Whispering Pines Way
- 536 Red Cedar Ridge Rd
- 347 Oak Haven Way
- 351 Oak Haven Way
- 2215 Island Blvd
- 2319 Island Blvd
- 3344 Frontier View Dr
- 3340 Frontier View Dr
- 2 Winfield Dunn Pkwy
- 0 Leatherwood Rd Unit 1291540
- Lot 2 Winfield Dunn Pkwy
- Lot 3 Winfield Dunn Pkwy
- 1434 Reedmont Way
- 1869 Begonia Way
- 1325 Reedmont Way
- 1317 Reedmont Way
- 225 Bobwhite Trail
- 1226 Reedmont Way
- OAK Haven Way
- 2009 Destiny Way
- 121 Oak Haven Way
- 130 Oak Haven Way
- 2010 Destiny Way
- 128 Bear Haven Way
- 120 Oak Haven Way
- 2002 Destiny Way
- 2019 Destiny Way
- 1371 Lake Haven Way Unit 13
- 2020 Destiny Way
- 2042 Whispering Pines Way
- 2017 Cluster Oak Way
- WHISPERING Pines Way
- lot 2 Lot 2 Lake Haven Way
- Lot 91 Lake Haven Way
- Lot 96 Jolene Way
- Lot 27 Lake Haven Way
- Lot 90 Lake Haven Way
- Lot 92 Lake Haven Way