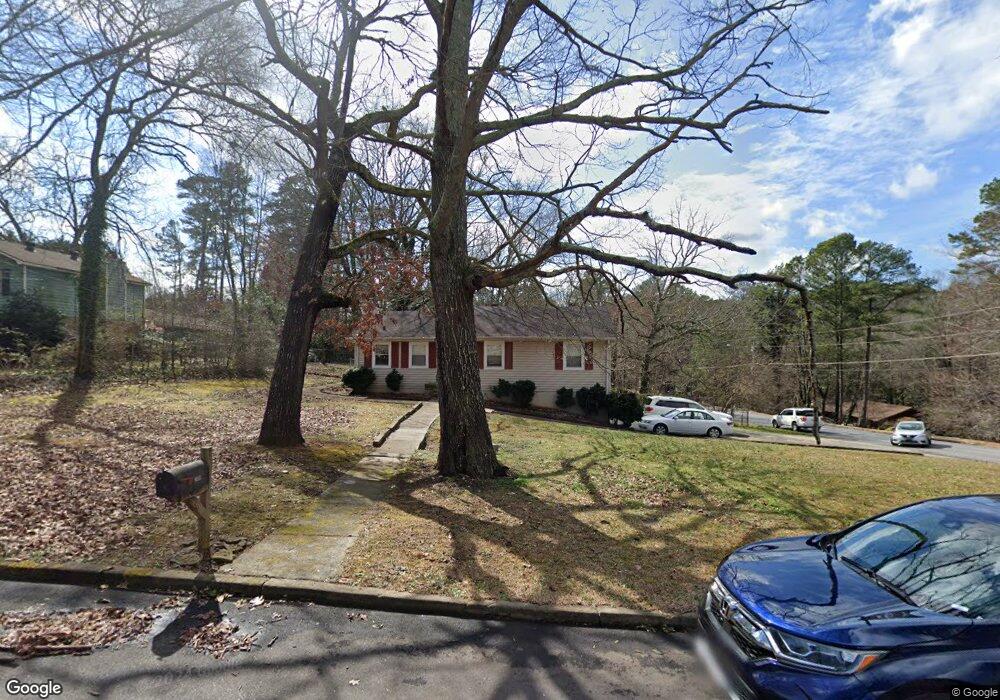
2005 Ellsberry St Unit 10 Snellville, GA 30078
Estimated Value: $329,000 - $358,000
4
Beds
2
Baths
1,890
Sq Ft
$183/Sq Ft
Est. Value
About This Home
This home is located at 2005 Ellsberry St Unit 10, Snellville, GA 30078 and is currently estimated at $346,713, approximately $183 per square foot. 2005 Ellsberry St Unit 10 is a home located in Gwinnett County with nearby schools including Head Elementary School, Five Forks Middle School, and Brookwood High School.
Ownership History
Date
Name
Owned For
Owner Type
Purchase Details
Closed on
Oct 7, 2016
Sold by
Suntrust Bank
Bought by
Enujioke Chukwudi
Current Estimated Value
Home Financials for this Owner
Home Financials are based on the most recent Mortgage that was taken out on this home.
Original Mortgage
$128,302
Outstanding Balance
$102,171
Interest Rate
3.42%
Estimated Equity
$244,542
Purchase Details
Closed on
Jul 20, 2016
Sold by
Suntrust Bk
Bought by
Enujioke Chukwudi
Home Financials for this Owner
Home Financials are based on the most recent Mortgage that was taken out on this home.
Original Mortgage
$128,302
Interest Rate
4.62%
Mortgage Type
FHA
Purchase Details
Closed on
Mar 1, 2016
Sold by
Mcfall Timothy D
Bought by
Suntrust Bank
Create a Home Valuation Report for This Property
The Home Valuation Report is an in-depth analysis detailing your home's value as well as a comparison with similar homes in the area
Home Values in the Area
Average Home Value in this Area
Purchase History
| Date | Buyer | Sale Price | Title Company |
|---|---|---|---|
| Enujioke Chukwudi | -- | -- | |
| Enujioke Chukwudi | $115,500 | -- | |
| Suntrust Bank | $115,003 | -- |
Source: Public Records
Mortgage History
| Date | Status | Borrower | Loan Amount |
|---|---|---|---|
| Open | Enujioke Chukwudi | $128,302 | |
| Closed | Enujioke Chukwudi | -- | |
| Previous Owner | Enujioke Chukwudi | $128,302 |
Source: Public Records
Tax History Compared to Growth
Tax History
| Year | Tax Paid | Tax Assessment Tax Assessment Total Assessment is a certain percentage of the fair market value that is determined by local assessors to be the total taxable value of land and additions on the property. | Land | Improvement |
|---|---|---|---|---|
| 2025 | $4,067 | $151,640 | $22,200 | $129,440 |
| 2024 | $3,931 | $139,360 | $22,200 | $117,160 |
| 2023 | $3,931 | $133,800 | $26,400 | $107,400 |
| 2022 | $3,472 | $118,880 | $23,600 | $95,280 |
| 2021 | $2,852 | $87,120 | $18,400 | $68,720 |
| 2020 | $2,720 | $80,120 | $16,000 | $64,120 |
| 2019 | $2,568 | $76,560 | $13,600 | $62,960 |
| 2018 | $2,458 | $71,520 | $13,600 | $57,920 |
| 2016 | $2,190 | $58,200 | $11,600 | $46,600 |
| 2015 | $1,889 | $49,200 | $9,200 | $40,000 |
| 2014 | $1,898 | $49,200 | $9,200 | $40,000 |
Source: Public Records
Map
Nearby Homes
- 2034 Britt Dr
- 2167 Foley Park St
- 2286 Foley Park St
- 1904 Britt Dr
- 2350 Action Way
- 2296 Thackery Rd
- 3487 Desoto Rd
- 2325 Thackery Rd
- 1893 Hedgestone Ct
- 1795 Elmwood Cir
- 3594 Hedgestone Ln
- 3588 Kelin Ct SW
- 1916 Oakwood Grove Dr Unit 1
- 1721 Bruckner Ct
- 3207 Aspen Cir SW
- 3430 Park Glenn Ln
- 1845 Lisa Springs Dr
- 3728 Kelin Ct SW
- 3063 Bruckner Blvd
- Kenwood Plan at Watson Park
- 2005 Ellsberry St
- 2013 Ellsberry St
- 3360 Hillside Dr
- 3355 Hillside Dr
- 3345 Hillside Dr
- 2006 Ellsberry St
- 2012 Ellsberry St
- 3335 Hillside Dr
- 3365 Hillside Dr
- 2033 Ellsberry St
- 8020 Hillside Climb Unit 207
- 8020 Hillside Climb
- 2022 Ellsberry St
- 2038 Elmwood Cir
- 2018 Elmwood Cir
- 3325 Hillside Dr
- 2032 Ellsberry St
- 2236 Foley Park Dst Unit 51
- 2256 Foley Park Dst Unit 53
- 2043 Ellsberry St