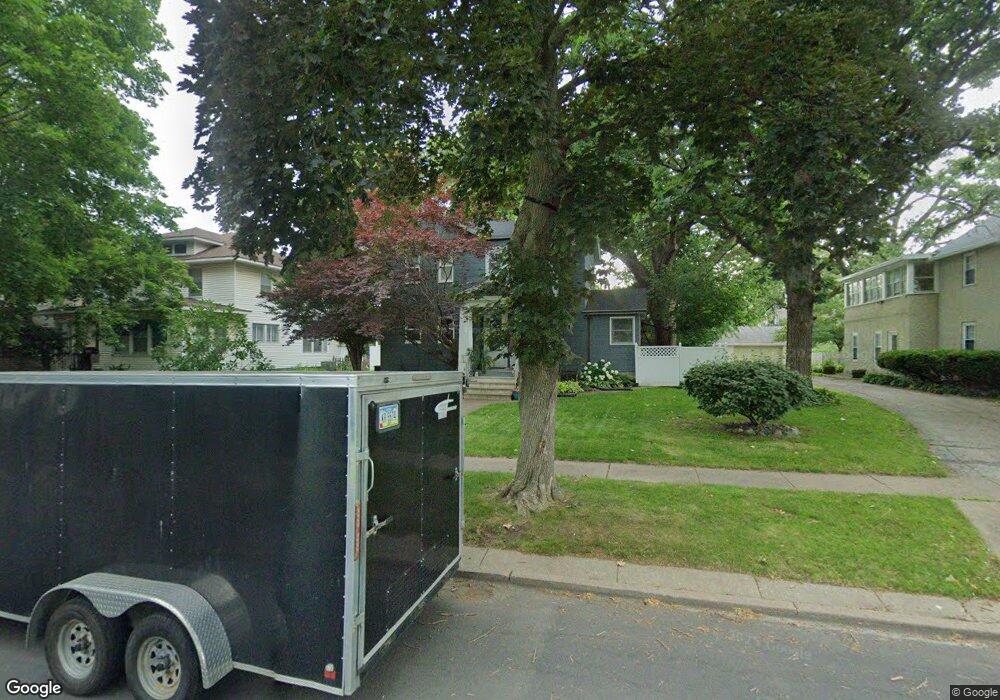
2005 Farnam St Davenport, IA 52803
Near North Side NeighborhoodEstimated Value: $203,000 - $245,000
4
Beds
4
Baths
2,754
Sq Ft
$81/Sq Ft
Est. Value
About This Home
This home is located at 2005 Farnam St, Davenport, IA 52803 and is currently estimated at $223,865, approximately $81 per square foot. 2005 Farnam St is a home located in Scott County with nearby schools including Crofton Elementary School, Casey County Middle School, and Hopkinsville Middle School.
Ownership History
Date
Name
Owned For
Owner Type
Purchase Details
Closed on
Sep 10, 2013
Sold by
Estate Of Delores Heussner
Bought by
Simmcring Nicole L and Simmcring Michael C
Current Estimated Value
Home Financials for this Owner
Home Financials are based on the most recent Mortgage that was taken out on this home.
Original Mortgage
$121,262
Outstanding Balance
$89,950
Interest Rate
4.25%
Mortgage Type
FHA
Estimated Equity
$133,915
Create a Home Valuation Report for This Property
The Home Valuation Report is an in-depth analysis detailing your home's value as well as a comparison with similar homes in the area
Home Values in the Area
Average Home Value in this Area
Purchase History
| Date | Buyer | Sale Price | Title Company |
|---|---|---|---|
| Simmcring Nicole L | $123,500 | None Available |
Source: Public Records
Mortgage History
| Date | Status | Borrower | Loan Amount |
|---|---|---|---|
| Open | Simmcring Nicole L | $121,262 |
Source: Public Records
Tax History Compared to Growth
Tax History
| Year | Tax Paid | Tax Assessment Tax Assessment Total Assessment is a certain percentage of the fair market value that is determined by local assessors to be the total taxable value of land and additions on the property. | Land | Improvement |
|---|---|---|---|---|
| 2025 | $3,260 | $204,570 | $37,770 | $166,800 |
| 2024 | $3,178 | $192,660 | $37,770 | $154,890 |
| 2023 | $2,640 | $192,660 | $37,770 | $154,890 |
| 2022 | $2,650 | $132,470 | $29,190 | $103,280 |
| 2021 | $2,650 | $132,470 | $29,190 | $103,280 |
| 2020 | $2,630 | $129,820 | $29,190 | $100,630 |
| 2019 | $2,722 | $129,820 | $29,190 | $100,630 |
| 2018 | $2,404 | $129,820 | $29,190 | $100,630 |
| 2017 | $2,490 | $118,220 | $29,190 | $89,030 |
| 2016 | $2,394 | $117,990 | $0 | $0 |
| 2015 | $2,394 | $118,640 | $0 | $0 |
| 2014 | $2,442 | $118,640 | $0 | $0 |
| 2013 | $2,320 | $0 | $0 | $0 |
| 2012 | -- | $117,530 | $25,940 | $91,590 |
Source: Public Records
Map
Nearby Homes
- 2024 Farnam St
- 625 E High St
- 2034 Farnam St
- 2211 Farnam St
- 618 Douglas Ct
- 2307 Farnam St
- 2215 Grand Ave
- 11 Oak Ln
- 2118 Arlington Ave
- 2319 Leclaire St
- 420 Kirkwood Blvd
- 511 Kirkwood Blvd
- 1812 Pershing Ave
- 224 E Rusholme St
- 325 E Dover Ct
- 325 Kirkwood Blvd
- 1605 Arlington Ave
- 1920 Carey Ave
- 916 Kirkwood Blvd
- 230 Kirkwood Blvd
- 2007 Farnam St
- 613 E Laurel St
- 1941 Farnam St
- 619 E Laurel St
- 1946 Walling Ct
- 1948 Walling Ct
- 1931 Farnam St
- 1942 Walling Ct
- 2029 Farnam St
- 1942 1/2 Walling Ct
- 1938 Walling Ct
- 616 E Laurel St
- 1927 Farnam St
- 2006 Farnam St
- 2010 Farnam St
- 1934 Walling Ct
- 2031 Farnam St
- 1950 Walling Ct
- 2014 Farnam St
- 628 E Laurel St