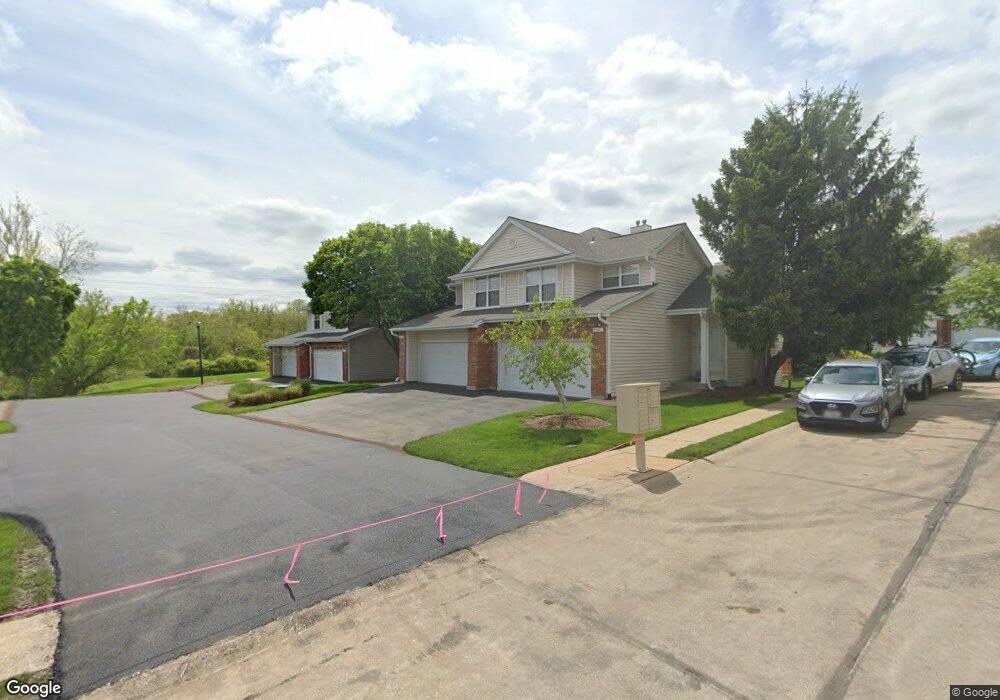
2005 King Arthur Ct Saint Louis, MO 63146
Estimated Value: $253,116 - $317,000
2
Beds
3
Baths
1,123
Sq Ft
$259/Sq Ft
Est. Value
About This Home
This home is located at 2005 King Arthur Ct, Saint Louis, MO 63146 and is currently estimated at $290,529, approximately $258 per square foot. 2005 King Arthur Ct is a home located in St. Louis County with nearby schools including McKelvey Elementary School, Parkway Northeast Middle School, and Parkway North High School.
Ownership History
Date
Name
Owned For
Owner Type
Purchase Details
Closed on
Sep 23, 2011
Sold by
Doray Balraj
Bought by
Chan Wan Ching
Current Estimated Value
Home Financials for this Owner
Home Financials are based on the most recent Mortgage that was taken out on this home.
Original Mortgage
$125,000
Outstanding Balance
$11,022
Interest Rate
4.24%
Mortgage Type
New Conventional
Estimated Equity
$279,507
Purchase Details
Closed on
Apr 30, 2010
Sold by
Doray Balraj
Bought by
Chan Wan Ching
Purchase Details
Closed on
Mar 26, 2004
Sold by
Schukar Alan L
Bought by
Doray Balra J and Chan Wan Ching
Home Financials for this Owner
Home Financials are based on the most recent Mortgage that was taken out on this home.
Original Mortgage
$142,400
Interest Rate
5.59%
Mortgage Type
Purchase Money Mortgage
Purchase Details
Closed on
Apr 16, 2001
Sold by
Prsha Katherine S
Bought by
Schukar Alan L
Home Financials for this Owner
Home Financials are based on the most recent Mortgage that was taken out on this home.
Original Mortgage
$115,000
Interest Rate
6.93%
Create a Home Valuation Report for This Property
The Home Valuation Report is an in-depth analysis detailing your home's value as well as a comparison with similar homes in the area
Home Values in the Area
Average Home Value in this Area
Purchase History
| Date | Buyer | Sale Price | Title Company |
|---|---|---|---|
| Chan Wan Ching | -- | Etc | |
| Chan Wan Ching | -- | None Available | |
| Doray Balra J | $178,000 | -- | |
| Schukar Alan L | $144,000 | -- | |
| Schukar Alan L | -- | -- |
Source: Public Records
Mortgage History
| Date | Status | Borrower | Loan Amount |
|---|---|---|---|
| Open | Chan Wan Ching | $125,000 | |
| Previous Owner | Doray Balra J | $142,400 | |
| Previous Owner | Schukar Alan L | $115,000 | |
| Closed | Doray Balra J | $26,700 |
Source: Public Records
Tax History Compared to Growth
Tax History
| Year | Tax Paid | Tax Assessment Tax Assessment Total Assessment is a certain percentage of the fair market value that is determined by local assessors to be the total taxable value of land and additions on the property. | Land | Improvement |
|---|---|---|---|---|
| 2025 | $2,672 | $44,720 | $8,680 | $36,040 |
| 2024 | $2,672 | $40,190 | $6,520 | $33,670 |
| 2023 | $2,564 | $40,190 | $6,520 | $33,670 |
| 2022 | $2,482 | $35,400 | $7,980 | $27,420 |
| 2021 | $2,472 | $35,400 | $7,980 | $27,420 |
| 2020 | $2,350 | $32,300 | $9,580 | $22,720 |
| 2019 | $2,299 | $32,300 | $9,580 | $22,720 |
| 2018 | $2,246 | $29,260 | $7,180 | $22,080 |
| 2017 | $2,185 | $29,260 | $7,180 | $22,080 |
| 2016 | $2,079 | $26,430 | $5,590 | $20,840 |
| 2015 | $2,178 | $26,430 | $5,590 | $20,840 |
| 2014 | $1,826 | $23,730 | $7,600 | $16,130 |
Source: Public Records
Map
Nearby Homes
- 13033 King Arthur Spur
- 1444 Nancy Lee Dr
- 12964 Autumn View Dr
- 12924 Autumn View Dr
- 13104 Fourposter Ct
- 1702 Pensacola Dr
- 13041 Tiger Lily Ct Unit 10
- 1834 Chelmsford Ct
- 1324 Golden Point Dr
- 12929 Portulaca Dr Unit 310
- 12917 Portulaca Dr Unit 225
- 13136 Oldfarm Dr
- 12818 Willowyck Dr
- 13118 Hickory Mill Ct
- 12980 Mayerling Dr
- 12812 Portulaca Dr Unit K
- 13101 Mill Crossing Ct Unit 306
- 13101 Mill Crossing Ct Unit 302
- 12725 Westport Dr
- 1935 Marine Terrace Dr Unit D
- 2001 King Arthur Ct
- 2015 King Arthur Ct
- 1939 King Arthur Ct
- 1941 King Arthur Ct
- 2029 King Arthur Ct
- 2033 King Arthur Ct
- 2050 King Arthur Ct
- 2025 King Arthur Ct
- 2021 King Arthur Ct
- 2046 King Arthur Ct
- 2042 King Arthur Ct
- 2037 King Arthur Ct
- 2038 King Arthur Ct
- 1933 King Arthur Ct
- 1932 King Arthur Ct
- 2041 King Arthur Ct
- 1930 King Arthur Ct
- 1935 King Arthur Ct Unit 40L
- 2054 King Arthur Ct
- 2058 King Arthur Ct