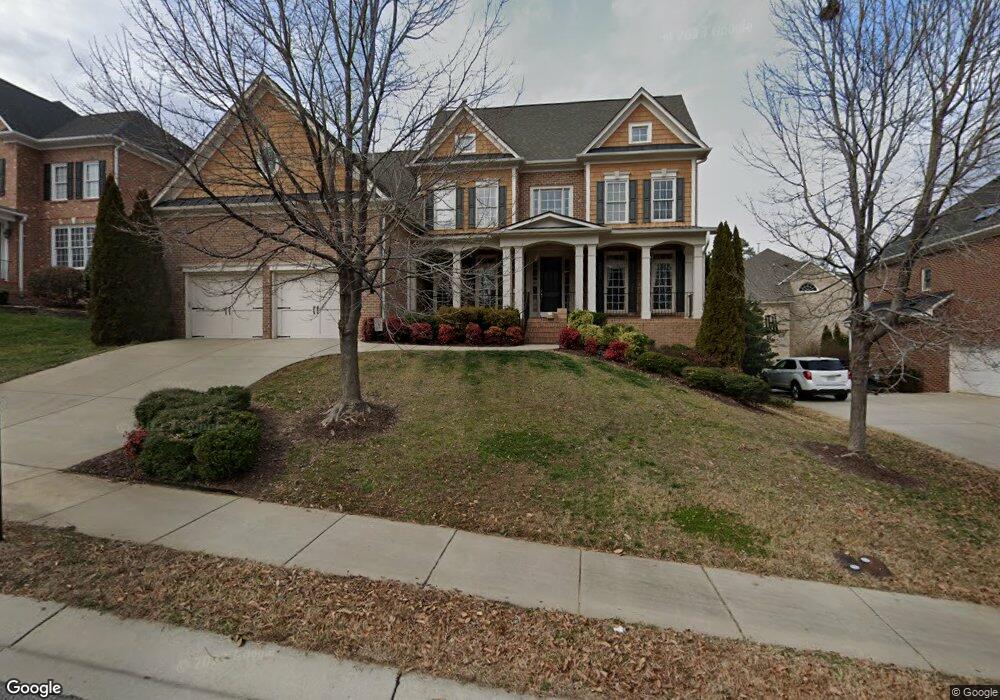
2005 Lowery Farm Ln Raleigh, NC 27614
Estimated Value: $861,000 - $938,000
5
Beds
4
Baths
4,007
Sq Ft
$223/Sq Ft
Est. Value
About This Home
This home is located at 2005 Lowery Farm Ln, Raleigh, NC 27614 and is currently estimated at $893,626, approximately $223 per square foot. 2005 Lowery Farm Ln is a home located in Wake County with nearby schools including Brassfield Elementary School, Wakefield Middle, and Wakefield High School.
Ownership History
Date
Name
Owned For
Owner Type
Purchase Details
Closed on
Oct 3, 2018
Sold by
Messenger Katheren P and Messenger David B
Bought by
Birch Brittany Bussian and Birch Tyler
Current Estimated Value
Home Financials for this Owner
Home Financials are based on the most recent Mortgage that was taken out on this home.
Original Mortgage
$396,525
Outstanding Balance
$345,793
Interest Rate
4.5%
Mortgage Type
New Conventional
Estimated Equity
$547,833
Purchase Details
Closed on
Feb 10, 2017
Sold by
Purser Mark S
Bought by
Purser Katheren L
Purchase Details
Closed on
Jan 21, 2010
Sold by
Federal National Mortgage Association
Bought by
Pursen Mark and Pursen Katheren
Purchase Details
Closed on
Jul 13, 2007
Sold by
John Wieland Homes & Neighborhoods Of Th
Bought by
Purser Mark S and Purser Katheren R
Home Financials for this Owner
Home Financials are based on the most recent Mortgage that was taken out on this home.
Original Mortgage
$47,000
Interest Rate
6.52%
Mortgage Type
Credit Line Revolving
Create a Home Valuation Report for This Property
The Home Valuation Report is an in-depth analysis detailing your home's value as well as a comparison with similar homes in the area
Home Values in the Area
Average Home Value in this Area
Purchase History
| Date | Buyer | Sale Price | Title Company |
|---|---|---|---|
| Birch Brittany Bussian | $466,500 | None Available | |
| Purser Katheren L | -- | None Available | |
| Pursen Mark | -- | None Available | |
| Purser Mark S | $536,000 | None Available |
Source: Public Records
Mortgage History
| Date | Status | Borrower | Loan Amount |
|---|---|---|---|
| Open | Birch Brittany Bussian | $396,525 | |
| Previous Owner | Purser Mark S | $47,000 | |
| Previous Owner | Purser Mark S | $417,000 |
Source: Public Records
Tax History Compared to Growth
Tax History
| Year | Tax Paid | Tax Assessment Tax Assessment Total Assessment is a certain percentage of the fair market value that is determined by local assessors to be the total taxable value of land and additions on the property. | Land | Improvement |
|---|---|---|---|---|
| 2025 | $7,413 | $847,691 | $140,000 | $707,691 |
| 2024 | $7,382 | $847,691 | $140,000 | $707,691 |
| 2023 | $5,603 | $512,215 | $76,000 | $436,215 |
| 2022 | $5,206 | $512,215 | $76,000 | $436,215 |
| 2021 | $5,004 | $512,215 | $76,000 | $436,215 |
| 2020 | $4,913 | $512,215 | $76,000 | $436,215 |
| 2019 | $6,232 | $536,029 | $100,000 | $436,029 |
| 2018 | $5,877 | $536,029 | $100,000 | $436,029 |
| 2017 | $5,596 | $536,029 | $100,000 | $436,029 |
| 2016 | $5,481 | $536,029 | $100,000 | $436,029 |
| 2015 | $5,848 | $562,814 | $108,800 | $454,014 |
| 2014 | -- | $562,814 | $108,800 | $454,014 |
Source: Public Records
Map
Nearby Homes
- 12019 Holmes Hollow Rd
- 2201 Wide River Dr
- 9508 Waterwood Ct
- 9531 Waterwood Ct
- 4113 Falls River Ave
- 3821 Falls River Ave
- 10701 Royal Forrest Dr
- 1711 Happiness Hill Ln
- 2061 Hopeton Ave
- 2419 Rogerson St
- 2116 Covered Bridge Ct
- 2051 Dunn Rd
- 1911 Falls Landing Dr Unit 103
- 1911 Falls Landing Dr Unit 106
- 2201 Karns Place
- 2420 Rogerson St
- 1500 River Mill Dr Unit 110
- 10507 Bedfordtown Dr
- 4406 Crystal Breeze St
- 1808 Falls Landing Dr
- 2009 Lowery Farm Ln
- 2001 Lowery Farm Ln
- 12005 Joseph Dr
- 11904 Lowery Farm Ln
- 2004 Lowery Farm Ln
- 1921 Lowery Farm Ln
- 2008 Lowery Farm Ln
- 12000 Joseph Dr
- 2012 Lowery Farm Ln
- 1917 Falls Farm Crossing
- 1917 Falls Fams Crossing
- 2001 Falls Farm Crossing
- 12009 Joseph Dr
- 1911 Lowery Farm Ln
- 2005 Falls Farm Crossing
- 12004 Joseph Dr
- 1913 Falls Farm Crossing
- 2005 Falls Fams Crossing
- 2008 Wide River Dr
- 12008 Joseph Dr