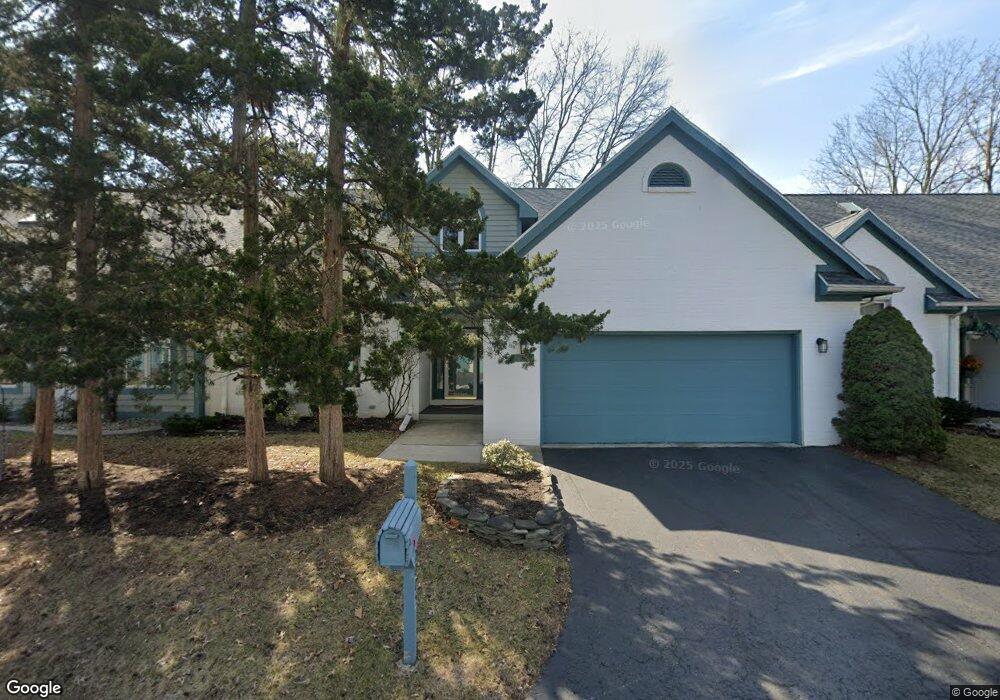
2005 Rush Creek Ct Unit 8 Findlay, OH 45840
Estimated Value: $305,000 - $346,568
3
Beds
3
Baths
2,428
Sq Ft
$135/Sq Ft
Est. Value
About This Home
This home is located at 2005 Rush Creek Ct Unit 8, Findlay, OH 45840 and is currently estimated at $328,892, approximately $135 per square foot. 2005 Rush Creek Ct Unit 8 is a home located in Hancock County with nearby schools including Wilson Vance Elementary School, Whittier Elementary School, and Glenwood Middle School.
Ownership History
Date
Name
Owned For
Owner Type
Purchase Details
Closed on
Dec 7, 2023
Sold by
Pfisterer Nina R
Bought by
Nina Pfisterer Family Trust and Pfisterer
Current Estimated Value
Purchase Details
Closed on
Mar 19, 2005
Sold by
Peterman Ann E
Bought by
Pfisterer Nina R and Stewart Norma K
Purchase Details
Closed on
Dec 11, 2003
Sold by
Fryfogle Jim B and Fryfogle Wendy K
Bought by
Pfisterer David A and Pfisterer Nina R
Home Financials for this Owner
Home Financials are based on the most recent Mortgage that was taken out on this home.
Original Mortgage
$189,000
Interest Rate
4.62%
Mortgage Type
Purchase Money Mortgage
Purchase Details
Closed on
Nov 22, 2002
Sold by
Beverly Burwell Trst
Bought by
Fryfogle Jim B and Fryfogle Wendy K
Home Financials for this Owner
Home Financials are based on the most recent Mortgage that was taken out on this home.
Original Mortgage
$213,300
Interest Rate
3.5%
Mortgage Type
New Conventional
Purchase Details
Closed on
Jul 23, 2001
Sold by
Hartman Richard L
Bought by
Burwell Beverly A
Home Financials for this Owner
Home Financials are based on the most recent Mortgage that was taken out on this home.
Original Mortgage
$64,250
Interest Rate
7.22%
Mortgage Type
New Conventional
Create a Home Valuation Report for This Property
The Home Valuation Report is an in-depth analysis detailing your home's value as well as a comparison with similar homes in the area
Home Values in the Area
Average Home Value in this Area
Purchase History
| Date | Buyer | Sale Price | Title Company |
|---|---|---|---|
| Nina Pfisterer Family Trust | -- | None Listed On Document | |
| Pfisterer Nina R | -- | -- | |
| Pfisterer David A | $239,000 | -- | |
| Fryfogle Jim B | $237,000 | -- | |
| Burwell Beverly A | $232,500 | -- |
Source: Public Records
Mortgage History
| Date | Status | Borrower | Loan Amount |
|---|---|---|---|
| Previous Owner | Pfisterer David A | $189,000 | |
| Previous Owner | Fryfogle Jim B | $213,300 | |
| Previous Owner | Burwell Beverly A | $64,250 |
Source: Public Records
Tax History
| Year | Tax Paid | Tax Assessment Tax Assessment Total Assessment is a certain percentage of the fair market value that is determined by local assessors to be the total taxable value of land and additions on the property. | Land | Improvement |
|---|---|---|---|---|
| 2024 | $2,925 | $92,150 | $2,800 | $89,350 |
| 2023 | $2,952 | $92,150 | $2,800 | $89,350 |
| 2022 | $2,957 | $92,150 | $2,800 | $89,350 |
| 2021 | $2,751 | $76,350 | $2,100 | $74,250 |
| 2020 | $2,751 | $76,350 | $2,100 | $74,250 |
| 2019 | $2,696 | $76,350 | $2,100 | $74,250 |
| 2018 | $2,645 | $69,600 | $2,100 | $67,500 |
| 2017 | $1,323 | $69,600 | $2,100 | $67,500 |
| 2016 | $2,605 | $69,600 | $2,100 | $67,500 |
| 2015 | $2,302 | $61,400 | $2,100 | $59,300 |
| 2014 | $2,302 | $61,400 | $2,100 | $59,300 |
| 2012 | $2,318 | $61,400 | $2,100 | $59,300 |
Source: Public Records
Map
Nearby Homes
- 2000 Rush Creek Ct
- 2245 Fox Run Cir Unit 1037
- 1121 Fox Run Rd
- 801 Fox Run Rd
- 821 Fox Run Rd Unit 6
- 1825 Greendale Ave
- 1926 Queenswood Dr
- 845 Fox Run Rd
- 1828 Queenswood Dr
- 631 Winterhaven Dr
- 1724 Queenswood Dr Unit 10 (2-C)
- 456 Strathaven Dr
- 701 Red Fox Rd
- 827 Abbey Ln
- 1203 Chateau Ct
- 1521 Middle Ct
- 0 Bright Rd Unit 6117142
- 0 Bright Rd Unit 6117138
- 0 Bright Rd Unit 6117143
- 0 Bright Rd Unit 6117148
- 2001 Rush Creek Ct
- 2009 Rush Creek Ct
- 2004 Rush Creek Ct
- 509 Bright Rd Unit 5
- 2023 Rush Creek Ct Unit 17
- 2018 Rush Creek Ct
- 2019 Rush Creek Ct
- 2027 Rush Creek Ct
- 507 Bright Rd
- 507 Bright Rd Unit 4
- 2020 Rush Creek Ct Unit U15
- 522 Bright Rd
- 516 Bright Rd
- 526 Bright Rd
- 2030 Rush Creek Ct
- 2034 Rush Creek Ct Unit 20
- 2038 Rush Creek Ct
- 508 Bright Rd
- 530 Bright Rd
- 503 Bright Rd
Your Personal Tour Guide
Ask me questions while you tour the home.