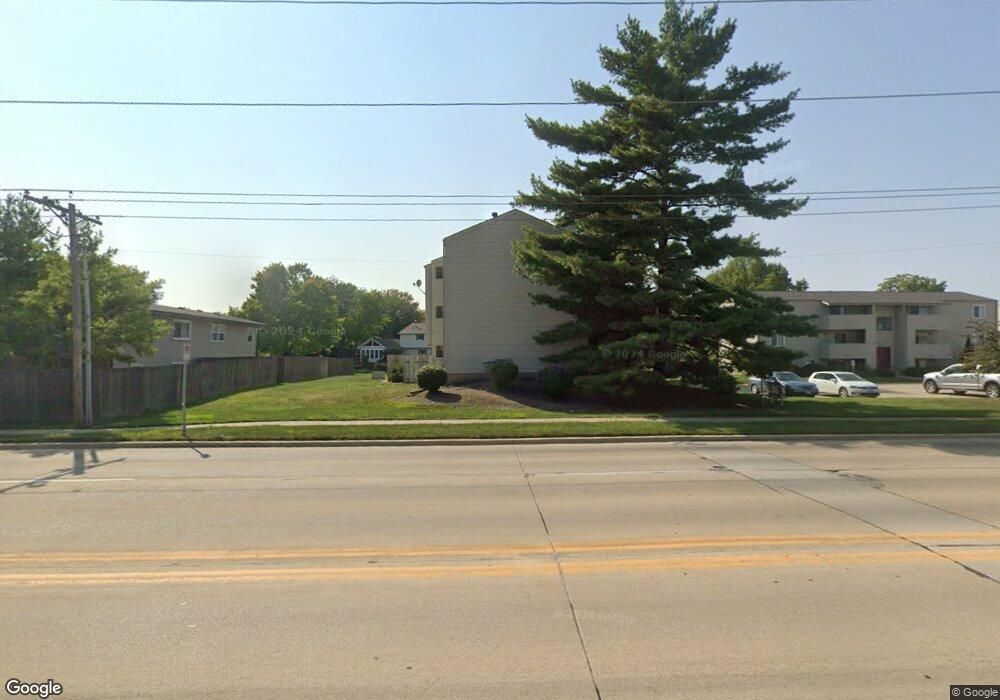
2005 S Mattis Ave Unit F Champaign, IL 61821
West Haven NeighborhoodEstimated Value: $95,000 - $130,000
2
Beds
1
Bath
1,018
Sq Ft
$107/Sq Ft
Est. Value
About This Home
This home is located at 2005 S Mattis Ave Unit F, Champaign, IL 61821 and is currently estimated at $108,642, approximately $106 per square foot. 2005 S Mattis Ave Unit F is a home located in Champaign County with nearby schools including Centennial High School, Next Generation School, and St. Matthew School.
Ownership History
Date
Name
Owned For
Owner Type
Purchase Details
Closed on
Nov 19, 2024
Sold by
Montague Rae-Anne and Marquez Juan Antonio
Bought by
Viallant Pierre
Current Estimated Value
Home Financials for this Owner
Home Financials are based on the most recent Mortgage that was taken out on this home.
Original Mortgage
$68,000
Interest Rate
6.6%
Mortgage Type
New Conventional
Purchase Details
Closed on
May 6, 2017
Sold by
Dale Steven J
Bought by
Montague Rae Anne and Castro Montague Juan Antonio
Home Financials for this Owner
Home Financials are based on the most recent Mortgage that was taken out on this home.
Original Mortgage
$60,750
Interest Rate
2.99%
Mortgage Type
Adjustable Rate Mortgage/ARM
Purchase Details
Closed on
Jun 15, 2010
Sold by
Johnson Kenneth A
Bought by
Dale Steven J
Home Financials for this Owner
Home Financials are based on the most recent Mortgage that was taken out on this home.
Original Mortgage
$56,250
Interest Rate
6.5%
Mortgage Type
New Conventional
Create a Home Valuation Report for This Property
The Home Valuation Report is an in-depth analysis detailing your home's value as well as a comparison with similar homes in the area
Home Values in the Area
Average Home Value in this Area
Purchase History
| Date | Buyer | Sale Price | Title Company |
|---|---|---|---|
| Viallant Pierre | $85,000 | None Listed On Document | |
| Montague Rae Anne | $67,500 | Attorney | |
| Dale Steven J | $62,500 | None Available |
Source: Public Records
Mortgage History
| Date | Status | Borrower | Loan Amount |
|---|---|---|---|
| Previous Owner | Viallant Pierre | $68,000 | |
| Previous Owner | Montague Rae Anne | $60,750 | |
| Previous Owner | Dale Steven J | $56,250 |
Source: Public Records
Tax History Compared to Growth
Tax History
| Year | Tax Paid | Tax Assessment Tax Assessment Total Assessment is a certain percentage of the fair market value that is determined by local assessors to be the total taxable value of land and additions on the property. | Land | Improvement |
|---|---|---|---|---|
| 2024 | $2,096 | $32,110 | $2,190 | $29,920 |
| 2023 | $2,096 | $29,240 | $1,990 | $27,250 |
| 2022 | $1,929 | $26,980 | $1,840 | $25,140 |
| 2021 | $2,421 | $26,450 | $1,800 | $24,650 |
| 2020 | $2,332 | $25,430 | $1,730 | $23,700 |
| 2019 | $2,256 | $24,900 | $1,690 | $23,210 |
| 2018 | $2,205 | $24,500 | $1,660 | $22,840 |
| 2017 | $1,672 | $24,500 | $1,660 | $22,840 |
| 2016 | $1,489 | $24,000 | $1,630 | $22,370 |
| 2015 | $1,491 | $23,570 | $1,600 | $21,970 |
| 2014 | $1,478 | $23,570 | $1,600 | $21,970 |
| 2013 | $1,465 | $23,570 | $1,600 | $21,970 |
Source: Public Records
Map
Nearby Homes
- 2001 S Mattis Ave Unit E
- 2113 Sunview Dr
- 1908 Barberry Cir
- 1928 Blackthorn Dr Unit 1
- 2144 Harbortown Cir Unit 2144
- 1901 Branch Rd
- 1901 Lakeside Dr Unit B
- 2302 Blackthorn Dr
- 2306 Winchester Dr
- 2313 Glenoak Dr
- 2009 Southwood Dr
- 2002 O Donnell Dr
- 1801 Crescent Dr
- 1318 Broadmoor Dr
- 2404 Windward Blvd Unit 202
- 2003 W Kirby Ave
- 2505 Windward Blvd Unit 2505
- 1612 W Kirby Ave
- 2521 Windward Blvd Unit 2521
- 1420 S Western Ave
- 2005 S Mattis Ave Unit C
- 2005 S Mattis Ave Unit B
- 2005 S Mattis Ave Unit D
- 2005 S Mattis Ave Unit A
- 2005 S Mattis Ave
- 2103 Ivy Ct
- 2101 Ivy Ct
- 2105 Ivy Ct
- 2003 S Mattis Ave Unit C
- 2003 S Mattis Ave Unit D
- 2003 S Mattis Ave Unit A
- 2003 S Mattis Ave Unit F
- 1924 Barberry Cir
- 2107 Ivy Ct
- 2001 Barberry Cir
- 1922 Barberry Cir
- 2009 Sunview Dr
- 2007 Sunview Dr
- 2011 Sunview Dr Unit 2011
- 2005 Sunview Dr Unit 2005