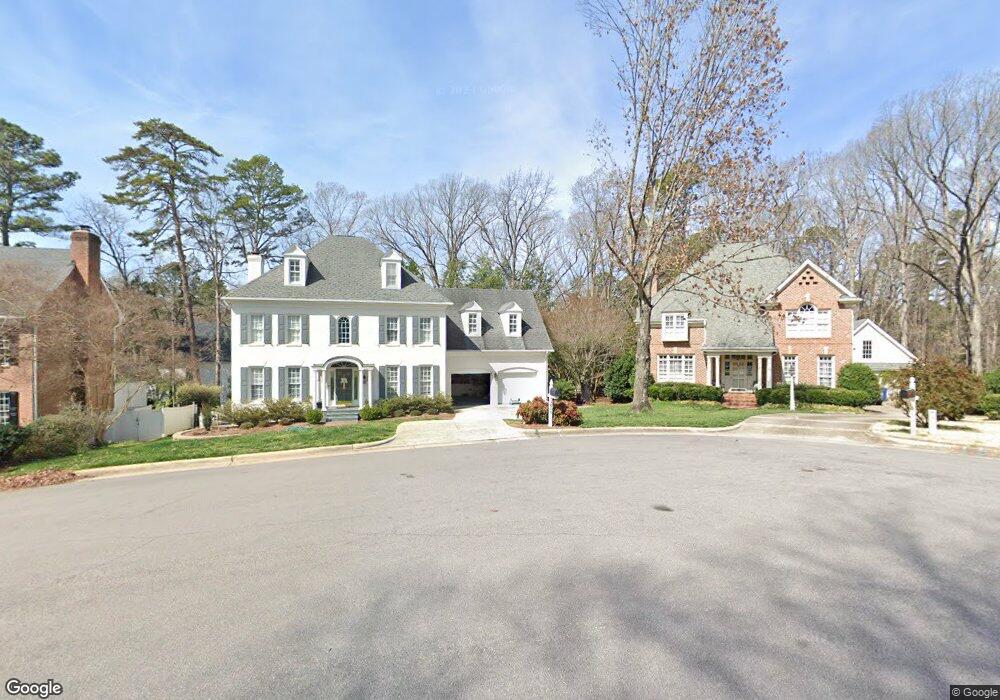
2005 Tradd Ct Raleigh, NC 27607
Inner Beltline West NeighborhoodEstimated Value: $1,502,000 - $1,694,000
5
Beds
4
Baths
3,839
Sq Ft
$409/Sq Ft
Est. Value
About This Home
This home is located at 2005 Tradd Ct, Raleigh, NC 27607 and is currently estimated at $1,568,235, approximately $408 per square foot. 2005 Tradd Ct is a home located in Wake County with nearby schools including Lacy Elementary, Leroy Martin Magnet, and Broughton Magnet High School.
Ownership History
Date
Name
Owned For
Owner Type
Purchase Details
Closed on
Oct 4, 2018
Sold by
Custer Scott and Custer Betsy
Bought by
Piper Adam and Piper Meredith C
Current Estimated Value
Home Financials for this Owner
Home Financials are based on the most recent Mortgage that was taken out on this home.
Original Mortgage
$600,000
Outstanding Balance
$524,349
Interest Rate
4.6%
Mortgage Type
New Conventional
Estimated Equity
$1,043,886
Purchase Details
Closed on
May 31, 2018
Sold by
Gaddy Parker M and Gaddy Elizabeth B
Bought by
Custer Scott
Purchase Details
Closed on
Jun 16, 2015
Sold by
Berger Martin S and Berger Jacqueline I
Bought by
Gaddy Parker M and Gaddy Elizabeth B
Home Financials for this Owner
Home Financials are based on the most recent Mortgage that was taken out on this home.
Original Mortgage
$779,000
Interest Rate
3.75%
Mortgage Type
Adjustable Rate Mortgage/ARM
Purchase Details
Closed on
Oct 9, 1991
Bought by
Berger Martin S and Berger Jacqueline I
Create a Home Valuation Report for This Property
The Home Valuation Report is an in-depth analysis detailing your home's value as well as a comparison with similar homes in the area
Home Values in the Area
Average Home Value in this Area
Purchase History
| Date | Buyer | Sale Price | Title Company |
|---|---|---|---|
| Piper Adam | $900,000 | None Available | |
| Custer Scott | $925,000 | None Available | |
| Gaddy Parker M | $779,000 | Attorney | |
| Berger Martin S | $330,000 | -- |
Source: Public Records
Mortgage History
| Date | Status | Borrower | Loan Amount |
|---|---|---|---|
| Open | Piper Adam | $600,000 | |
| Previous Owner | Gaddy Parker M | $779,000 |
Source: Public Records
Tax History Compared to Growth
Tax History
| Year | Tax Paid | Tax Assessment Tax Assessment Total Assessment is a certain percentage of the fair market value that is determined by local assessors to be the total taxable value of land and additions on the property. | Land | Improvement |
|---|---|---|---|---|
| 2025 | $11,736 | $1,343,468 | $500,000 | $843,468 |
| 2024 | $11,688 | $1,343,468 | $500,000 | $843,468 |
| 2023 | $10,087 | $945,232 | $350,000 | $595,232 |
| 2022 | $9,156 | $902,289 | $350,000 | $552,289 |
| 2021 | $8,799 | $902,289 | $350,000 | $552,289 |
| 2020 | $8,639 | $902,289 | $350,000 | $552,289 |
| 2019 | $8,997 | $774,578 | $225,000 | $549,578 |
| 2018 | $8,483 | $774,578 | $225,000 | $549,578 |
| 2017 | $8,078 | $774,578 | $225,000 | $549,578 |
| 2016 | $7,911 | $774,578 | $225,000 | $549,578 |
| 2015 | $8,316 | $801,170 | $229,500 | $571,670 |
| 2014 | $7,886 | $801,170 | $229,500 | $571,670 |
Source: Public Records
Map
Nearby Homes
- 1617 Ridge Rd
- 3417 Horton St
- 1323 Ridge Rd
- 3303 Ridgecrest Ct
- 3418 Leonard St
- 3406 Leonard St
- 3324 Thomas Rd
- 3422 Redbud Ln
- 3005 Lewis Farm Rd
- 2308 Myron Dr Unit 201
- 1316 Dixie Trail
- 3032 Lewis Farm Rd
- 3030 Lewis Farm Rd
- 3304 Redbud Ln
- 3401 Caldwell Dr
- 1229 Dixie Trail
- 3317 Harden Rd
- 1225 Dixie Trail
- 1221 Dixie Trail
- 3304 Wade Ave
- 2001 Tradd Ct
- 2009 Tradd Ct
- 3512 Catalano Dr
- 2013 Tradd Ct
- 3528 Catalano Dr
- 2000 Tradd Ct
- 2004 Tradd Ct
- 2008 Tradd Ct
- 3516 Catalano Dr
- 3509 Catalano Dr
- 1501 Ridge Rd
- 1501 10th Ave
- 3505 Catalano Dr
- 1505 Ridge Rd
- 1505 10th Ave
- 3517 Catalano Dr
- 1509 10th Ave
- 1509 Ridge Rd
- 3501 Catalano Dr
- 2001 Caminos Dr