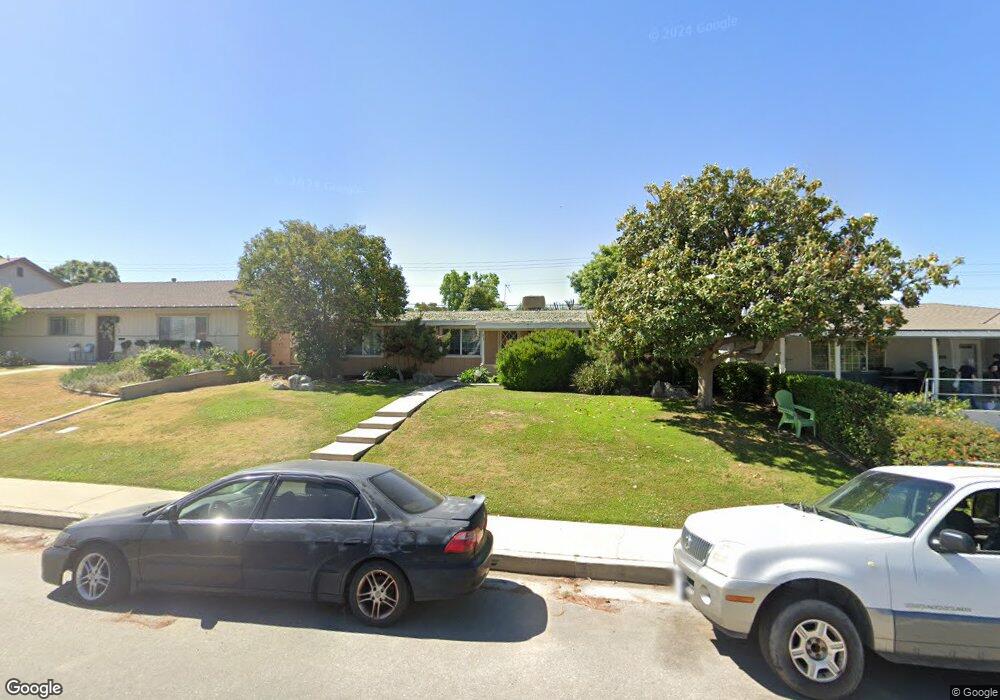
2005 University Ave Bakersfield, CA 93305
College Heights NeighborhoodEstimated Value: $322,000 - $352,000
3
Beds
2
Baths
1,696
Sq Ft
$196/Sq Ft
Est. Value
About This Home
This home is located at 2005 University Ave, Bakersfield, CA 93305 and is currently estimated at $332,108, approximately $195 per square foot. 2005 University Ave is a home located in Kern County with nearby schools including Colonel Howard Nichols Elementary School, Chipman Junior High School, and East Bakersfield High School.
Ownership History
Date
Name
Owned For
Owner Type
Purchase Details
Closed on
Sep 21, 2002
Sold by
Martinez Adolfo V
Bought by
Martinez Irene
Current Estimated Value
Home Financials for this Owner
Home Financials are based on the most recent Mortgage that was taken out on this home.
Original Mortgage
$116,910
Outstanding Balance
$48,552
Interest Rate
6.16%
Estimated Equity
$283,556
Purchase Details
Closed on
Sep 13, 2002
Sold by
Ornelas Joe L and Ornelas Veronica
Bought by
Martinez Irene
Home Financials for this Owner
Home Financials are based on the most recent Mortgage that was taken out on this home.
Original Mortgage
$116,910
Outstanding Balance
$48,552
Interest Rate
6.16%
Estimated Equity
$283,556
Purchase Details
Closed on
Apr 3, 1997
Sold by
Sundstrom Sharon Lee
Bought by
Ornelas Joe L and Ornelas Veronica
Home Financials for this Owner
Home Financials are based on the most recent Mortgage that was taken out on this home.
Original Mortgage
$72,000
Interest Rate
7.92%
Create a Home Valuation Report for This Property
The Home Valuation Report is an in-depth analysis detailing your home's value as well as a comparison with similar homes in the area
Home Values in the Area
Average Home Value in this Area
Purchase History
| Date | Buyer | Sale Price | Title Company |
|---|---|---|---|
| Martinez Irene | -- | Chicago Title | |
| Martinez Irene | $130,000 | Chicago Title | |
| Ornelas Joe L | $85,000 | Commonwealth Land Title Co |
Source: Public Records
Mortgage History
| Date | Status | Borrower | Loan Amount |
|---|---|---|---|
| Open | Martinez Irene | $116,910 | |
| Previous Owner | Ornelas Joe L | $72,000 |
Source: Public Records
Tax History Compared to Growth
Tax History
| Year | Tax Paid | Tax Assessment Tax Assessment Total Assessment is a certain percentage of the fair market value that is determined by local assessors to be the total taxable value of land and additions on the property. | Land | Improvement |
|---|---|---|---|---|
| 2025 | $2,877 | $188,117 | $31,852 | $156,265 |
| 2024 | $2,816 | $184,429 | $31,228 | $153,201 |
| 2023 | $2,816 | $180,814 | $30,616 | $150,198 |
| 2022 | $2,750 | $177,269 | $30,016 | $147,253 |
| 2021 | $2,638 | $173,794 | $29,428 | $144,366 |
| 2020 | $2,601 | $172,013 | $29,127 | $142,886 |
| 2019 | $2,550 | $172,013 | $29,127 | $142,886 |
| 2018 | $2,492 | $165,336 | $27,997 | $137,339 |
| 2017 | $2,478 | $162,096 | $27,449 | $134,647 |
| 2016 | $2,273 | $158,918 | $26,911 | $132,007 |
| 2015 | $2,260 | $156,532 | $26,507 | $130,025 |
| 2014 | $2,187 | $153,466 | $25,988 | $127,478 |
Source: Public Records
Map
Nearby Homes
- 2109 University Ave
- 3112 Saint Marys St
- 3113 Occidental St
- 1605 Duke Dr
- 3516 Dana St Unit 3
- 3516 Dana St Unit 10
- 1513 University Ave
- 2905 Arnold St
- 3901 Noel Place
- 2825 Arnold St
- 1416 Duke Dr
- 2600 Driller Ave
- 2700 University Ave
- 2701 Kaibab Ave
- 2904 Cornell St
- 1312 Shattuck Ave
- 2801 Kaibab Ave
- 1208 W Point Dr
- 1321 Panorama Dr
- 2804 Haley St
- 2001 University Ave
- 2009 University Ave
- 2013 University Ave
- 2004 Duke Dr
- 2000 Duke Dr
- 2008 Duke Dr
- 1921 University Ave
- 2012 Duke Dr
- 1920 Duke Dr
- 1917 University Ave
- 2100 Duke Dr
- 2105 University Ave
- 2104 Duke Dr
- 1913 University Ave
- 2005 Duke Dr
- 2001 Duke Dr
- 2009 Duke Dr
- 1912 Duke Dr
- 2013 Duke Dr
- 2108 Duke Dr