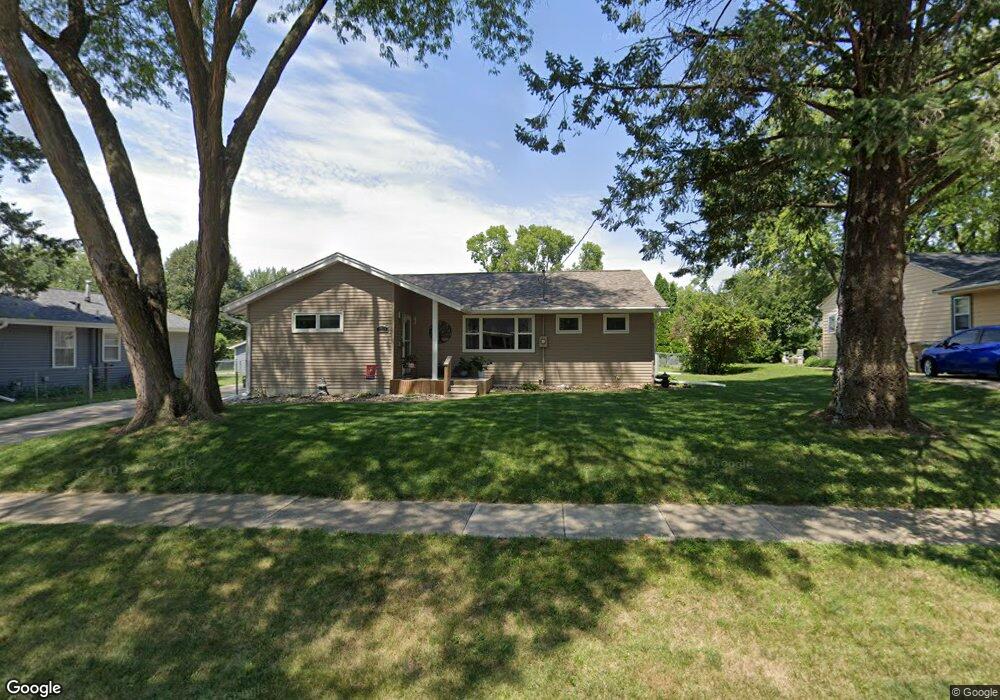
2005 Vine St West Des Moines, IA 50265
Estimated Value: $252,229 - $268,000
3
Beds
2
Baths
1,256
Sq Ft
$207/Sq Ft
Est. Value
About This Home
This home is located at 2005 Vine St, West Des Moines, IA 50265 and is currently estimated at $260,307, approximately $207 per square foot. 2005 Vine St is a home located in Polk County with nearby schools including Fairmeadows Elementary School, Stilwell Junior High School, and Valley Southwoods Freshman High School.
Ownership History
Date
Name
Owned For
Owner Type
Purchase Details
Closed on
Jan 21, 2012
Sold by
Seely Stacy S and Bryan Alice M
Bought by
Moore Thomas L and Moore Christina A
Current Estimated Value
Home Financials for this Owner
Home Financials are based on the most recent Mortgage that was taken out on this home.
Original Mortgage
$121,806
Outstanding Balance
$83,307
Interest Rate
3.93%
Mortgage Type
FHA
Estimated Equity
$177,000
Purchase Details
Closed on
Dec 8, 2010
Sold by
Madison James A
Bought by
Seely Stacy S and Bryan Alice M
Create a Home Valuation Report for This Property
The Home Valuation Report is an in-depth analysis detailing your home's value as well as a comparison with similar homes in the area
Home Values in the Area
Average Home Value in this Area
Purchase History
| Date | Buyer | Sale Price | Title Company |
|---|---|---|---|
| Moore Thomas L | $124,500 | None Available | |
| Seely Stacy S | -- | None Available |
Source: Public Records
Mortgage History
| Date | Status | Borrower | Loan Amount |
|---|---|---|---|
| Open | Moore Thomas L | $121,806 |
Source: Public Records
Tax History Compared to Growth
Tax History
| Year | Tax Paid | Tax Assessment Tax Assessment Total Assessment is a certain percentage of the fair market value that is determined by local assessors to be the total taxable value of land and additions on the property. | Land | Improvement |
|---|---|---|---|---|
| 2025 | $2,926 | $232,900 | $75,000 | $157,900 |
| 2024 | $2,926 | $203,700 | $65,300 | $138,400 |
| 2023 | $2,954 | $203,700 | $65,300 | $138,400 |
| 2022 | $2,916 | $165,200 | $55,300 | $109,900 |
| 2021 | $2,906 | $165,200 | $55,300 | $109,900 |
| 2020 | $2,856 | $156,800 | $52,200 | $104,600 |
| 2019 | $2,916 | $156,800 | $52,200 | $104,600 |
| 2018 | $2,916 | $154,100 | $45,700 | $108,400 |
| 2017 | $2,726 | $154,100 | $45,700 | $108,400 |
| 2016 | $2,660 | $140,700 | $41,100 | $99,600 |
| 2015 | $2,660 | $140,700 | $41,100 | $99,600 |
| 2014 | $2,452 | $142,300 | $40,800 | $101,500 |
Source: Public Records
Map
Nearby Homes
- 2009 Vine St
- 1916 Locust St
- 1829 Locust St
- 1829 Pearl Dr
- 720 19th St
- 725 20th St
- 417 18th Place
- 1809 Pearl Dr
- 2021 Elm Cir
- 1909 Prospect Ave
- 2300 Locust St
- 262 23rd St
- 2006 Maple Cir
- 2002 Maple Cir
- 2100 Meadow Brook Dr Unit 103
- 2412 Fairlawn Dr
- 842 23rd St
- 2509 Fairlawn Dr
- 212 25th St
- 2013 Crown Flair Dr