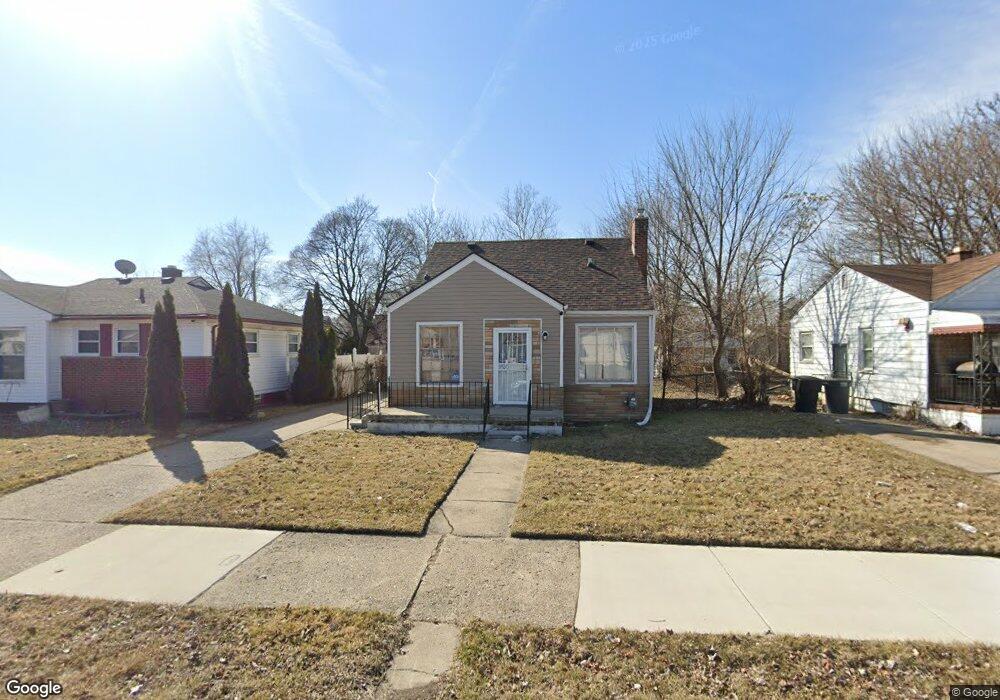
20057 Moenart St Unit Bldg-Unit Detroit, MI 48234
Farwell NeighborhoodEstimated Value: $52,000 - $74,177
--
Bed
1
Bath
983
Sq Ft
$64/Sq Ft
Est. Value
About This Home
This home is located at 20057 Moenart St Unit Bldg-Unit, Detroit, MI 48234 and is currently estimated at $62,544, approximately $63 per square foot. 20057 Moenart St Unit Bldg-Unit is a home located in Wayne County with nearby schools including Mason Academy, Edward 'Duke' Ellington Conservatory of Music and Art, and Charles L. Spain Elementary-Middle School.
Ownership History
Date
Name
Owned For
Owner Type
Purchase Details
Closed on
Jun 7, 2018
Sold by
Rta Holdings Llc
Bought by
Branley Chelsea
Current Estimated Value
Purchase Details
Closed on
Aug 12, 2015
Sold by
Smith Thomas and Smith Suzanne
Bought by
Rta Holdings Llc
Purchase Details
Closed on
Dec 1, 2014
Sold by
Wayne County Treasurer
Bought by
Smith Thomas and Rta Holdings Llc
Purchase Details
Closed on
Aug 1, 2009
Sold by
Ealy Mary Ruth
Bought by
Davis Sonya Marie and Davis Deandre Ervin Oden
Purchase Details
Closed on
May 10, 2007
Sold by
Gtc Investment Co Inc
Bought by
Ealy Mary R
Purchase Details
Closed on
Apr 11, 2007
Sold by
Abood John C and Abood Deborah
Bought by
Gtc Investment Co Inc
Create a Home Valuation Report for This Property
The Home Valuation Report is an in-depth analysis detailing your home's value as well as a comparison with similar homes in the area
Home Values in the Area
Average Home Value in this Area
Purchase History
| Date | Buyer | Sale Price | Title Company |
|---|---|---|---|
| Branley Chelsea | $1,000 | None Available | |
| Rta Holdings Llc | -- | None Available | |
| Smith Thomas | $1,600 | None Available | |
| Davis Sonya Marie | $50,000 | Philip F Greco Title Company | |
| Ealy Mary R | $34,000 | Colonial Title Company | |
| Ealy Mary R | -- | Colonial Title Company | |
| Gtc Investment Co Inc | $25,000 | Colonial Title Company | |
| Gtc Investment Co Inc | -- | Colonial Title Company |
Source: Public Records
Tax History Compared to Growth
Tax History
| Year | Tax Paid | Tax Assessment Tax Assessment Total Assessment is a certain percentage of the fair market value that is determined by local assessors to be the total taxable value of land and additions on the property. | Land | Improvement |
|---|---|---|---|---|
| 2025 | $788 | $24,600 | $0 | $0 |
| 2024 | $788 | $21,100 | $0 | $0 |
| 2023 | $862 | $16,700 | $0 | $0 |
| 2022 | $913 | $14,100 | $0 | $0 |
| 2021 | $890 | $10,800 | $0 | $0 |
| 2020 | $890 | $9,700 | $0 | $0 |
| 2019 | $878 | $7,800 | $0 | $0 |
| 2018 | $782 | $7,300 | $0 | $0 |
| 2017 | $131 | $6,900 | $0 | $0 |
| 2016 | $987 | $16,700 | $0 | $0 |
| 2015 | $990 | $9,900 | $0 | $0 |
| 2013 | $1,233 | $12,326 | $0 | $0 |
| 2010 | -- | $18,072 | $1,139 | $16,933 |
Source: Public Records
Map
Nearby Homes
- 20057 Keystone St
- 20059 Bloom St
- 19948 Moenart St
- 20253 Moenart St
- 19931 Keystone St
- 3191 E Outer Dr
- 20200 Caldwell St
- 3040 E Outer Dr
- 20258 Caldwell St
- 20511 Caldwell St
- 19696 Healy St
- 19608 Buffalo St
- 19451 Conley St
- 19437 Conley St
- 19403 Moenart St
- 20818 Atlantic Ave
- 19347 Moenart St
- 19345 Keystone St
- 19366 Fenelon St
- 19373 Fenelon St
- 20057 Moenart St
- 20050 Keystone St
- 20040 Keystone St
- 20060 Keystone St
- 20047 Moenart St
- 20067 Moenart St
- 20030 Keystone St
- 20037 Moenart St
- 20070 Keystone St
- 20075 Moenart St
- 20027 Moenart St
- 20020 Keystone St Unit Bldg-Unit
- 20020 Keystone St
- 20085 Moenart St
- 20080 Keystone St
- 20021 Moenart St
- 20091 Moenart St
- 20010 Keystone St
- 20090 Keystone St
- 20011 Moenart St