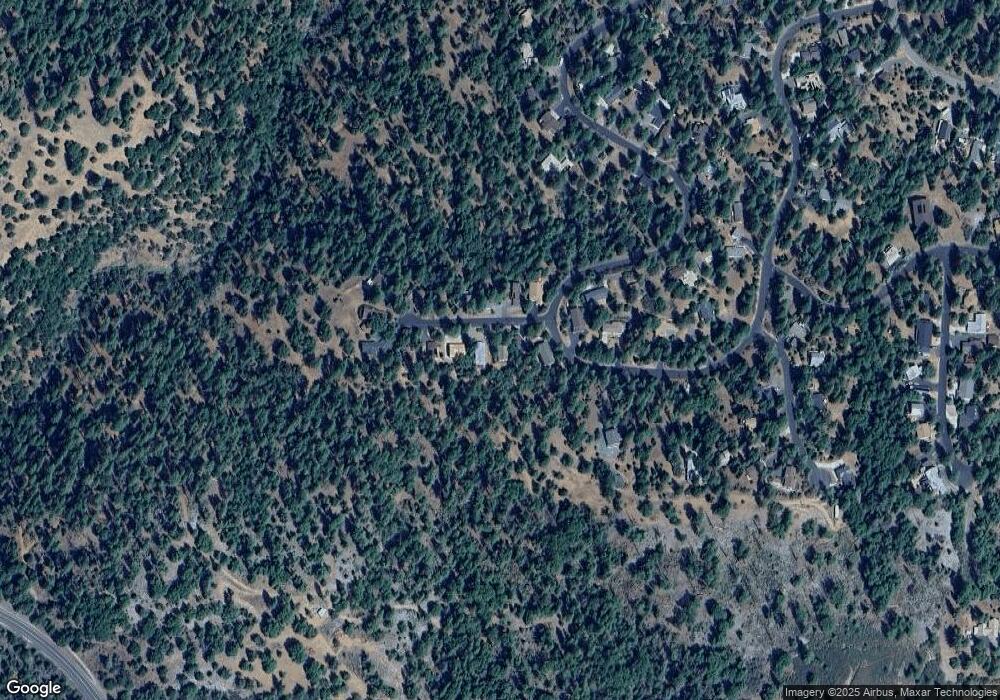
20059 Bluebell Ct Groveland, CA 95321
Estimated Value: $300,583 - $324,000
2
Beds
2
Baths
1,144
Sq Ft
$273/Sq Ft
Est. Value
About This Home
This home is located at 20059 Bluebell Ct, Groveland, CA 95321 and is currently estimated at $311,896, approximately $272 per square foot. 20059 Bluebell Ct is a home located in Tuolumne County.
Ownership History
Date
Name
Owned For
Owner Type
Purchase Details
Closed on
Jan 14, 2003
Sold by
Reynolds John R and Reynolds Jenny L
Bought by
Hancock Shirley A
Current Estimated Value
Home Financials for this Owner
Home Financials are based on the most recent Mortgage that was taken out on this home.
Original Mortgage
$132,000
Outstanding Balance
$55,532
Interest Rate
5.83%
Mortgage Type
Purchase Money Mortgage
Estimated Equity
$256,364
Create a Home Valuation Report for This Property
The Home Valuation Report is an in-depth analysis detailing your home's value as well as a comparison with similar homes in the area
Home Values in the Area
Average Home Value in this Area
Purchase History
| Date | Buyer | Sale Price | Title Company |
|---|---|---|---|
| Hancock Shirley A | $165,000 | Yosemite Title Co |
Source: Public Records
Mortgage History
| Date | Status | Borrower | Loan Amount |
|---|---|---|---|
| Open | Hancock Shirley A | $132,000 | |
| Closed | Hancock Shirley A | $24,750 |
Source: Public Records
Tax History Compared to Growth
Tax History
| Year | Tax Paid | Tax Assessment Tax Assessment Total Assessment is a certain percentage of the fair market value that is determined by local assessors to be the total taxable value of land and additions on the property. | Land | Improvement |
|---|---|---|---|---|
| 2025 | $2,582 | $238,964 | $43,444 | $195,520 |
| 2024 | $2,582 | $234,280 | $42,593 | $191,687 |
| 2023 | $2,526 | $229,687 | $41,758 | $187,929 |
| 2022 | $2,477 | $225,185 | $40,940 | $184,245 |
| 2021 | $2,206 | $199,399 | $41,828 | $157,571 |
| 2020 | $2,051 | $186,355 | $39,092 | $147,263 |
| 2019 | $1,989 | $182,700 | $38,325 | $144,375 |
| 2018 | $1,888 | $174,000 | $36,500 | $137,500 |
| 2017 | $1,707 | $158,000 | $33,000 | $125,000 |
| 2016 | $1,624 | $151,200 | $31,500 | $119,700 |
| 2015 | $1,550 | $144,000 | $30,000 | $114,000 |
| 2014 | $1,276 | $119,082 | $21,651 | $97,431 |
Source: Public Records
Map
Nearby Homes
- 12080 Breckenridge Rd
- 19935 Pine Mountain Dr
- 20280 Little Valley Rd
- 19673 Jonny Degnan Ct
- 12000 Trapper Ct
- 20029 Upper Skyridge Dr Unit 15
- 20197 Upper Skyridge Dr
- 12309 Shooting Star Ct
- 19824 Pine Mountain Dr
- 12435 Cassaretto Ct
- 20018 Pine Mountain Dr
- 19710 Butler Way
- 20128 Lower Skyridge Dr
- 12064 Hillhurst Cir
- 19779 Pine Mountain Dr
- 20069 Bluebell Ct Unit 13, Lot 61
- 20069 Bluebell Ct
- 20051 Bluebell Ct
- 12047 Breckenridge Rd
- 20039 Bluebell Ct Unit 58
- 20039 Bluebell Ct Unit 13
- 12054 Breckenridge Rd
- 12054 Breckenridge Rd Unit 117
- 20029 Bluebell Ct Unit 57
- 20029 Bluebell Ct
- 20072 Bluebell Ct
- 12046 Breckenridge Rd Unit 114
- 12046 Breckenridge Rd
- 20060 Bluebell Ct
- 20019 Bluebell Ct Unit 56
- 20019 Bluebell Ct
- 12043 Breckenridge Rd
- 20020 Bluebell Ct
- 12050 Breckenridge Rd Unit 13-115
- 12050 Breckenridge Rd
