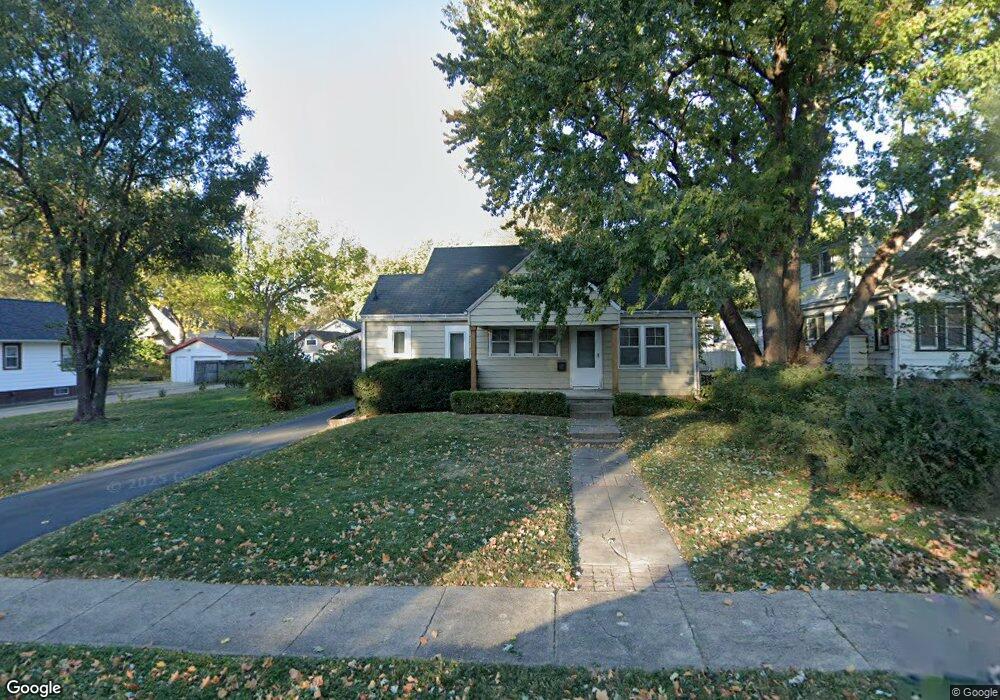
2006 38th St Des Moines, IA 50310
Beaverdale NeighborhoodEstimated Value: $236,000 - $252,000
3
Beds
1
Bath
1,142
Sq Ft
$212/Sq Ft
Est. Value
About This Home
This home is located at 2006 38th St, Des Moines, IA 50310 and is currently estimated at $241,902, approximately $211 per square foot. 2006 38th St is a home located in Polk County with nearby schools including Perkins Elementary School, Merrill Middle School, and Roosevelt High School.
Ownership History
Date
Name
Owned For
Owner Type
Purchase Details
Closed on
Aug 12, 2001
Sold by
King Colin C and King Carrie Jo
Bought by
Wagner Jeffrey C
Current Estimated Value
Home Financials for this Owner
Home Financials are based on the most recent Mortgage that was taken out on this home.
Original Mortgage
$115,900
Outstanding Balance
$44,697
Interest Rate
7.15%
Mortgage Type
VA
Estimated Equity
$197,205
Purchase Details
Closed on
Apr 13, 1998
Sold by
Johnson Daniel Allen and Johnson Amy Payne
Bought by
King Colin C and Pierce Carrie
Home Financials for this Owner
Home Financials are based on the most recent Mortgage that was taken out on this home.
Original Mortgage
$85,276
Interest Rate
7.19%
Mortgage Type
FHA
Create a Home Valuation Report for This Property
The Home Valuation Report is an in-depth analysis detailing your home's value as well as a comparison with similar homes in the area
Home Values in the Area
Average Home Value in this Area
Purchase History
| Date | Buyer | Sale Price | Title Company |
|---|---|---|---|
| Wagner Jeffrey C | $115,500 | -- | |
| King Colin C | $85,000 | -- |
Source: Public Records
Mortgage History
| Date | Status | Borrower | Loan Amount |
|---|---|---|---|
| Open | Wagner Jeffrey C | $115,900 | |
| Previous Owner | King Colin C | $85,276 |
Source: Public Records
Tax History Compared to Growth
Tax History
| Year | Tax Paid | Tax Assessment Tax Assessment Total Assessment is a certain percentage of the fair market value that is determined by local assessors to be the total taxable value of land and additions on the property. | Land | Improvement |
|---|---|---|---|---|
| 2025 | $3,946 | $245,100 | $45,600 | $199,500 |
| 2024 | $3,946 | $221,600 | $41,000 | $180,600 |
| 2023 | $4,036 | $219,700 | $41,000 | $178,700 |
| 2022 | $4,002 | $183,500 | $36,200 | $147,300 |
| 2021 | $3,868 | $183,500 | $36,200 | $147,300 |
| 2020 | $4,012 | $166,900 | $33,100 | $133,800 |
| 2019 | $3,722 | $166,900 | $33,100 | $133,800 |
| 2018 | $3,678 | $150,300 | $29,500 | $120,800 |
| 2017 | $3,262 | $150,300 | $29,500 | $120,800 |
| 2016 | $3,172 | $132,400 | $25,800 | $106,600 |
| 2015 | $3,172 | $132,400 | $25,800 | $106,600 |
| 2014 | $3,042 | $126,500 | $24,500 | $102,000 |
Source: Public Records
Map
Nearby Homes