2006 62nd St Des Moines, IA 50322
Merle Hay NeighborhoodEstimated Value: $267,430 - $296,000
Studio
4
Baths
2,052
Sq Ft
$137/Sq Ft
Est. Value
About This Home
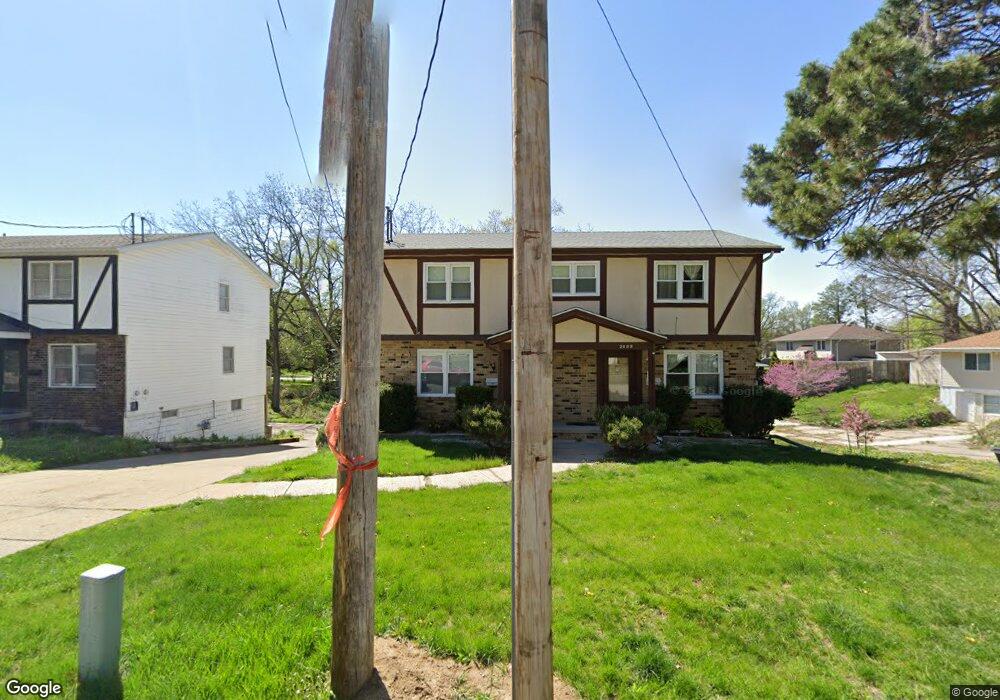
This home is located at 2006 62nd St, Des Moines, IA 50322 and is currently estimated at $280,858, approximately $136 per square foot. 2006 62nd St is a home located in Polk County with nearby schools including Hillis Elementary School, Merrill Middle School, and Roosevelt High School.
Ownership History
Date
Name
Owned For
Owner Type
Purchase Details
Closed on
May 10, 2001
Sold by
Caponi Damiano and Caponi Patricia P
Bought by
Bell Woodrow D
Current Estimated Value
Home Financials for this Owner
Home Financials are based on the most recent Mortgage that was taken out on this home.
Original Mortgage
$134,690
Outstanding Balance
$49,652
Interest Rate
7.02%
Mortgage Type
FHA
Estimated Equity
$231,206
Purchase Details
Closed on
May 7, 2001
Sold by
Bell Woodrow D and Bell Sandy
Bought by
Ramirez Sandra
Home Financials for this Owner
Home Financials are based on the most recent Mortgage that was taken out on this home.
Original Mortgage
$134,690
Outstanding Balance
$49,652
Interest Rate
7.02%
Mortgage Type
FHA
Estimated Equity
$231,206
Create a Home Valuation Report for This Property
The Home Valuation Report is an in-depth analysis detailing your home's value as well as a comparison with similar homes in the area
Home Values in the Area
Average Home Value in this Area
Purchase History
| Date | Buyer | Sale Price | Title Company |
|---|---|---|---|
| Bell Woodrow D | -- | -- | |
| Ramirez Sandra | $138,500 | -- |
Source: Public Records
Mortgage History
| Date | Status | Borrower | Loan Amount |
|---|---|---|---|
| Open | Ramirez Sandra | $134,690 |
Source: Public Records
Tax History
| Year | Tax Paid | Tax Assessment Tax Assessment Total Assessment is a certain percentage of the fair market value that is determined by local assessors to be the total taxable value of land and additions on the property. | Land | Improvement |
|---|---|---|---|---|
| 2025 | $4,608 | $273,000 | $49,800 | $223,200 |
| 2024 | $4,608 | $244,700 | $43,800 | $200,900 |
| 2023 | $4,794 | $244,700 | $43,800 | $200,900 |
| 2022 | $4,756 | $212,300 | $39,500 | $172,800 |
| 2021 | $4,542 | $212,300 | $39,500 | $172,800 |
| 2020 | $4,712 | $190,600 | $35,200 | $155,400 |
| 2019 | $4,482 | $190,600 | $35,200 | $155,400 |
| 2018 | $4,432 | $175,300 | $30,800 | $144,500 |
| 2017 | $3,914 | $175,300 | $30,800 | $144,500 |
| 2016 | $3,808 | $153,200 | $26,800 | $126,400 |
| 2015 | $3,808 | $153,200 | $26,800 | $126,400 |
| 2014 | $2,728 | $111,400 | $22,800 | $88,600 |
Source: Public Records
Map
Nearby Homes
Your Personal Tour Guide
Ask me questions while you tour the home.