2006 Duncan Ct Murfreesboro, TN 37129
Estimated Value: $490,000 - $586,000
--
Bed
3
Baths
2,954
Sq Ft
$187/Sq Ft
Est. Value
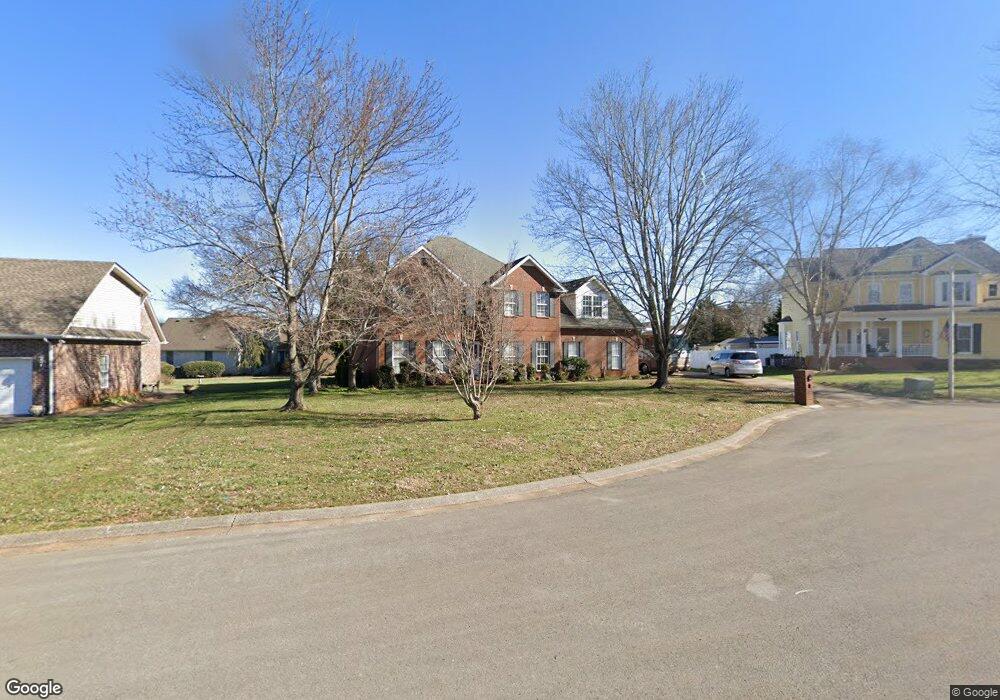
About This Home
This home is located at 2006 Duncan Ct, Murfreesboro, TN 37129 and is currently estimated at $551,533, approximately $186 per square foot. 2006 Duncan Ct is a home located in Rutherford County with nearby schools including Northfield Elementary School, Siegel Middle School, and Siegel High School.
Ownership History
Date
Name
Owned For
Owner Type
Purchase Details
Closed on
Dec 30, 2013
Sold by
Malone Richard P
Bought by
Johnson Matthew Richard H
Current Estimated Value
Home Financials for this Owner
Home Financials are based on the most recent Mortgage that was taken out on this home.
Original Mortgage
$243,508
Outstanding Balance
$183,694
Interest Rate
4.37%
Mortgage Type
FHA
Estimated Equity
$367,839
Purchase Details
Closed on
Jul 1, 1999
Sold by
Ben Barrett
Bought by
Malone Richard P
Home Financials for this Owner
Home Financials are based on the most recent Mortgage that was taken out on this home.
Original Mortgage
$75,000
Interest Rate
7.43%
Create a Home Valuation Report for This Property
The Home Valuation Report is an in-depth analysis detailing your home's value as well as a comparison with similar homes in the area
Home Values in the Area
Average Home Value in this Area
Purchase History
| Date | Buyer | Sale Price | Title Company |
|---|---|---|---|
| Johnson Matthew Richard H | $248,000 | -- | |
| Malone Richard P | $205,400 | -- |
Source: Public Records
Mortgage History
| Date | Status | Borrower | Loan Amount |
|---|---|---|---|
| Open | Johnson Matthew Richard H | $243,508 | |
| Previous Owner | Malone Richard P | $75,000 |
Source: Public Records
Tax History Compared to Growth
Tax History
| Year | Tax Paid | Tax Assessment Tax Assessment Total Assessment is a certain percentage of the fair market value that is determined by local assessors to be the total taxable value of land and additions on the property. | Land | Improvement |
|---|---|---|---|---|
| 2025 | $2,972 | $105,050 | $15,000 | $90,050 |
| 2024 | $2,972 | $105,050 | $15,000 | $90,050 |
| 2023 | $1,971 | $105,050 | $15,000 | $90,050 |
| 2022 | $1,698 | $105,050 | $15,000 | $90,050 |
| 2021 | $1,653 | $74,475 | $13,125 | $61,350 |
| 2020 | $1,653 | $74,475 | $13,125 | $61,350 |
| 2019 | $1,653 | $74,475 | $13,125 | $61,350 |
| 2018 | $2,271 | $74,475 | $0 | $0 |
| 2017 | $2,687 | $69,125 | $0 | $0 |
| 2016 | $2,687 | $69,125 | $0 | $0 |
| 2015 | $2,687 | $69,125 | $0 | $0 |
| 2014 | $1,719 | $69,125 | $0 | $0 |
| 2013 | -- | $69,425 | $0 | $0 |
Source: Public Records
Map
Nearby Homes