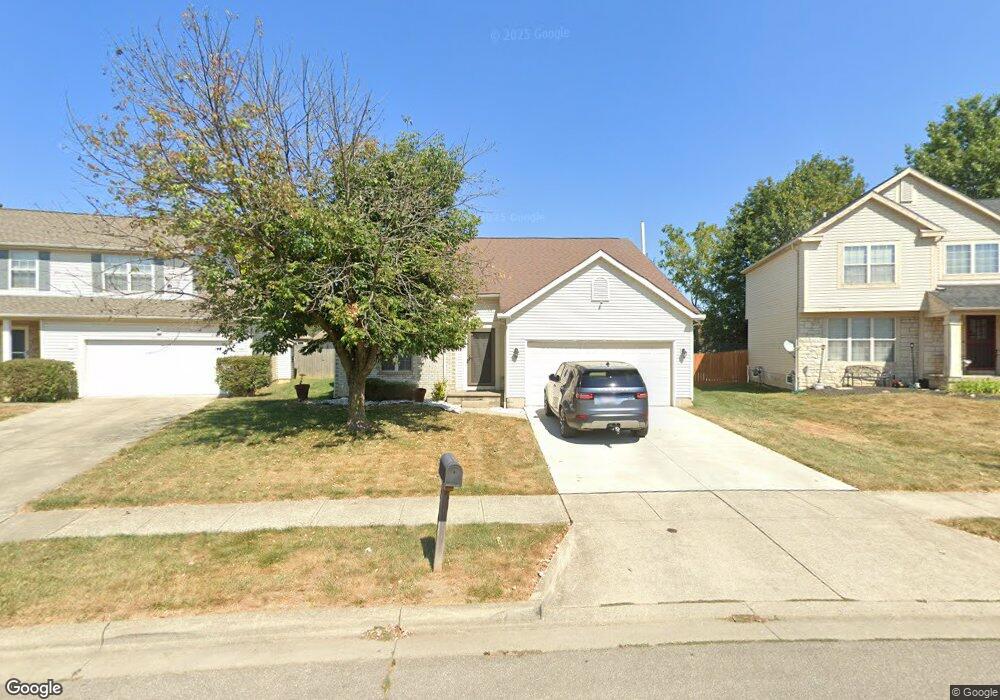
2006 Hegemon Crest Dr Columbus, OH 43219
Brittany Hills NeighborhoodEstimated Value: $261,000 - $344,000
3
Beds
3
Baths
1,872
Sq Ft
$158/Sq Ft
Est. Value
About This Home
This home is located at 2006 Hegemon Crest Dr, Columbus, OH 43219 and is currently estimated at $295,830, approximately $158 per square foot. 2006 Hegemon Crest Dr is a home located in Franklin County with nearby schools including South Mifflin Stem Academy (K-6), Linden-Mckinley Stem School On Arcadia, and Cesar Chavez College Preparatory School.
Ownership History
Date
Name
Owned For
Owner Type
Purchase Details
Closed on
Jul 16, 2019
Sold by
Francis Darrell A and Francis Sharon A
Bought by
Francis Darrell A and Francis Sharon A
Current Estimated Value
Purchase Details
Closed on
Nov 3, 2000
Sold by
Joshua Investment Company
Bought by
Francis Darrell A and Francis Sharon A
Home Financials for this Owner
Home Financials are based on the most recent Mortgage that was taken out on this home.
Original Mortgage
$150,400
Outstanding Balance
$55,736
Interest Rate
7.96%
Estimated Equity
$240,094
Purchase Details
Closed on
Jun 16, 2000
Sold by
Miracit Development Corp Inc
Bought by
Joshua Investment Company
Purchase Details
Closed on
Jun 14, 2000
Sold by
Columbus Metropolitan Housing Authority
Bought by
Miracit Development Corp Inc
Create a Home Valuation Report for This Property
The Home Valuation Report is an in-depth analysis detailing your home's value as well as a comparison with similar homes in the area
Home Values in the Area
Average Home Value in this Area
Purchase History
| Date | Buyer | Sale Price | Title Company |
|---|---|---|---|
| Francis Darrell A | -- | None Available | |
| Francis Darrell A | $150,700 | Central City Title Agency | |
| Joshua Investment Company | $28,000 | Central City Title Agency | |
| Miracit Development Corp Inc | -- | Preferred Title |
Source: Public Records
Mortgage History
| Date | Status | Borrower | Loan Amount |
|---|---|---|---|
| Open | Francis Darrell A | $150,400 | |
| Closed | Francis Darrell A | $5,000 |
Source: Public Records
Tax History Compared to Growth
Tax History
| Year | Tax Paid | Tax Assessment Tax Assessment Total Assessment is a certain percentage of the fair market value that is determined by local assessors to be the total taxable value of land and additions on the property. | Land | Improvement |
|---|---|---|---|---|
| 2024 | $3,919 | $87,330 | $21,530 | $65,800 |
| 2023 | $3,869 | $87,325 | $21,525 | $65,800 |
| 2022 | $2,547 | $49,110 | $9,630 | $39,480 |
| 2021 | $2,552 | $49,110 | $9,630 | $39,480 |
| 2020 | $2,555 | $49,110 | $9,630 | $39,480 |
| 2019 | $2,385 | $39,310 | $7,700 | $31,610 |
| 2018 | $2,401 | $39,310 | $7,700 | $31,610 |
| 2017 | $2,383 | $39,310 | $7,700 | $31,610 |
| 2016 | $2,669 | $40,290 | $6,090 | $34,200 |
| 2015 | $2,423 | $40,290 | $6,090 | $34,200 |
| 2014 | $2,429 | $40,290 | $6,090 | $34,200 |
| 2013 | $1,331 | $44,765 | $6,755 | $38,010 |
Source: Public Records
Map
Nearby Homes
- 2471 Mock Rd
- 2336 Edenburgh Dr S
- 2398 Dunkirk Dr
- 0 Mock Rd
- 1882 Dunning Rd
- 1794 Devonshire Rd
- 1808 Brentnell Ave
- 0 Danby Dr
- 2736 Bellero Way Unit 94
- 1860 Meadowlawn Dr Unit 75
- 1790 Marston Rd
- 2054 Jermain Dr
- 1789 Marston Rd
- 1991 Woodland Ave
- 2483 Vendome Dr
- 2193 Rustic Ledge Dr
- 0 Rankin Ave Unit (Rear)
- 2228 Holt Ave
- 2424 Holt Ave
- 2040 Loretta Ave
- 2012 Hegemon Crest Dr
- 2000 Hegemon Crest Dr
- 2018 Hegemon Crest Dr
- 1994 Hegemon Crest Dr
- 2479 Mock Rd
- 2487 Mock Rd
- 2024 Hegemon Crest Dr
- 2009 Hegemon Crest Dr
- 1997 Hegemon Crest Dr
- 1988 Hegemon Crest Dr
- 2463 Mock Rd
- 2034 Hegemon Crest Dr
- 2027 Hegemon Crest Dr
- 1983 Hegemon Crest Dr
- 1982 Hegemon Crest Dr
- 1979 Bar Harbor Rd
- 2455 Mock Rd
- 1985 Bar Harbor Rd
- 2040 Hegemon Crest Dr
- 2037 Hegemon Crest Dr