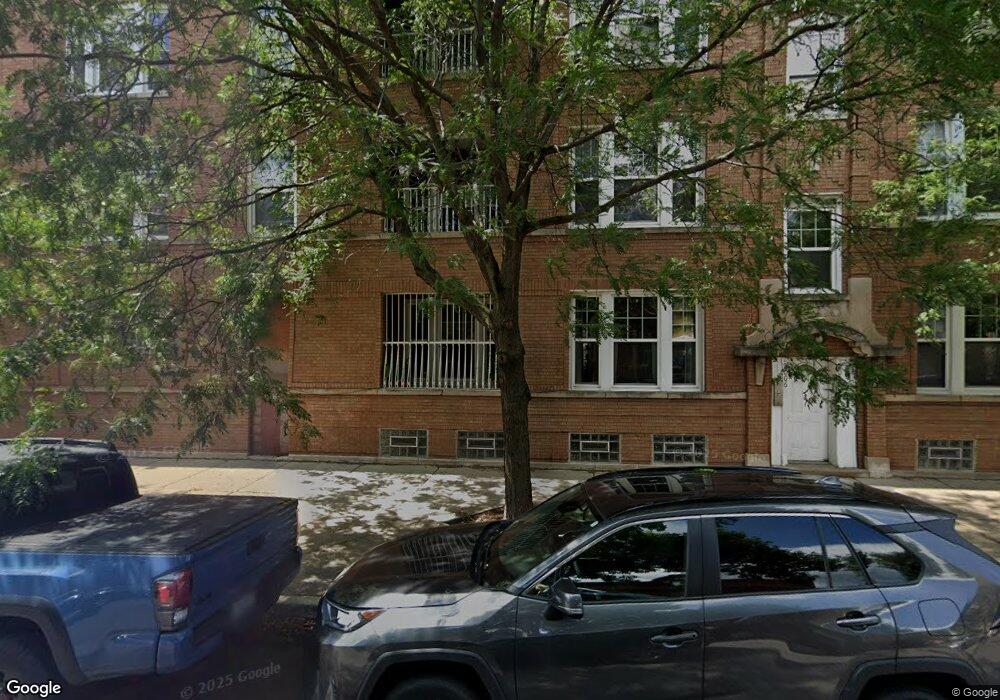
2006 N Spaulding Ave Unit 2006 Chicago, IL 60647
Logan Square NeighborhoodEstimated Value: $284,004 - $342,000
2
Beds
1
Bath
850
Sq Ft
$364/Sq Ft
Est. Value
About This Home
This home is located at 2006 N Spaulding Ave Unit 2006, Chicago, IL 60647 and is currently estimated at $309,001, approximately $363 per square foot. 2006 N Spaulding Ave Unit 2006 is a home located in Cook County with nearby schools including Frederick Funston Elementary School, Clemente Community Academy High School, and St. Sylvester School.
Ownership History
Date
Name
Owned For
Owner Type
Purchase Details
Closed on
Jul 9, 2020
Sold by
Best Aaron Minor and Czerwinski Catherine Mara
Bought by
Munger Devin E
Current Estimated Value
Home Financials for this Owner
Home Financials are based on the most recent Mortgage that was taken out on this home.
Original Mortgage
$176,000
Interest Rate
2.9%
Mortgage Type
New Conventional
Purchase Details
Closed on
Nov 2, 2016
Sold by
Grieveson Koren and Grieveson Jill
Bought by
Best Aaron Minor and Czerwinski Catherine Mara
Purchase Details
Closed on
Aug 15, 2005
Sold by
3300 Armitage Llc
Bought by
Grieveson Koren and Grieveson Jill
Home Financials for this Owner
Home Financials are based on the most recent Mortgage that was taken out on this home.
Original Mortgage
$147,900
Interest Rate
5.8%
Mortgage Type
Fannie Mae Freddie Mac
Create a Home Valuation Report for This Property
The Home Valuation Report is an in-depth analysis detailing your home's value as well as a comparison with similar homes in the area
Home Values in the Area
Average Home Value in this Area
Purchase History
| Date | Buyer | Sale Price | Title Company |
|---|---|---|---|
| Munger Devin E | $220,000 | North American Title Company | |
| Best Aaron Minor | $187,000 | Chicago Title | |
| Grieveson Koren | $185,000 | Multiple |
Source: Public Records
Mortgage History
| Date | Status | Borrower | Loan Amount |
|---|---|---|---|
| Previous Owner | Munger Devin E | $176,000 | |
| Previous Owner | Grieveson Koren | $147,900 |
Source: Public Records
Tax History Compared to Growth
Tax History
| Year | Tax Paid | Tax Assessment Tax Assessment Total Assessment is a certain percentage of the fair market value that is determined by local assessors to be the total taxable value of land and additions on the property. | Land | Improvement |
|---|---|---|---|---|
| 2024 | $4,235 | $22,630 | $2,218 | $20,412 |
| 2023 | $4,127 | $20,000 | $1,798 | $18,202 |
| 2022 | $4,127 | $20,000 | $1,798 | $18,202 |
| 2021 | $4,035 | $19,999 | $1,798 | $18,201 |
| 2020 | $3,416 | $15,277 | $869 | $14,408 |
| 2019 | $3,459 | $17,153 | $869 | $16,284 |
| 2018 | $3,388 | $17,153 | $869 | $16,284 |
| 2017 | $3,347 | $15,547 | $779 | $14,768 |
| 2016 | $2,614 | $15,547 | $779 | $14,768 |
| 2015 | $2,368 | $15,547 | $779 | $14,768 |
| 2014 | $1,174 | $8,894 | $719 | $8,175 |
| 2013 | $1,139 | $8,894 | $719 | $8,175 |
Source: Public Records
Map
Nearby Homes
- 3265 W Armitage Ave
- 2025 N Sawyer Ave
- 1926 N Sawyer Ave
- 1939 N Sawyer Ave Unit G
- 3219 W Dickens Ave
- 2040 N Kedzie Ave Unit 2
- 1928 N Kedzie Ave Unit 403
- 1928 N Kedzie Ave Unit 306
- 1918 N Kedzie Ave
- 2121 N Saint Louis Ave Unit 3S
- 3522 W Armitage Ave
- 3518 W Cortland St
- 1814 N Sawyer Ave
- 1816 N Spaulding Ave Unit 8
- 1819 N Saint Louis Ave Unit 1FS
- 2139 N Kedzie Blvd Unit 2
- 2137 N Kedzie Blvd Unit G
- 3544 W Cortland St Unit BA
- 1902 N Albany Ave
- 3060 W Armitage Ave
- 3302 W Armitage Ave Unit 33022
- 3302 W Armitage Ave Unit 33023
- 2006 N Spaulding Ave Unit 2006
- 2006 N Spaulding Ave Unit 2006
- 2006 N Spaulding Ave Unit 2
- 3302 W Armitage Ave Unit 2
- 2006 N Spaulding Ave Unit 1
- 2010 N Spaulding Ave Unit 2010
- 2010 N Spaulding Ave Unit 2010
- 2010 N Spaulding Ave Unit 2010
- 2010 N Spaulding Ave Unit 3
- 2010 N Spaulding Ave Unit 2
- 2010 N Spaulding Ave Unit 1
- 3306 W Armitage Ave
- 3308 W Armitage Ave Unit B
- 3308 W Armitage Ave Unit D
- 3310 W Armitage Ave Unit 2E
- 2016 N Spaulding Ave Unit 3E
- 2016 N Spaulding Ave Unit P5
- 2016 N Spaulding Ave Unit P4