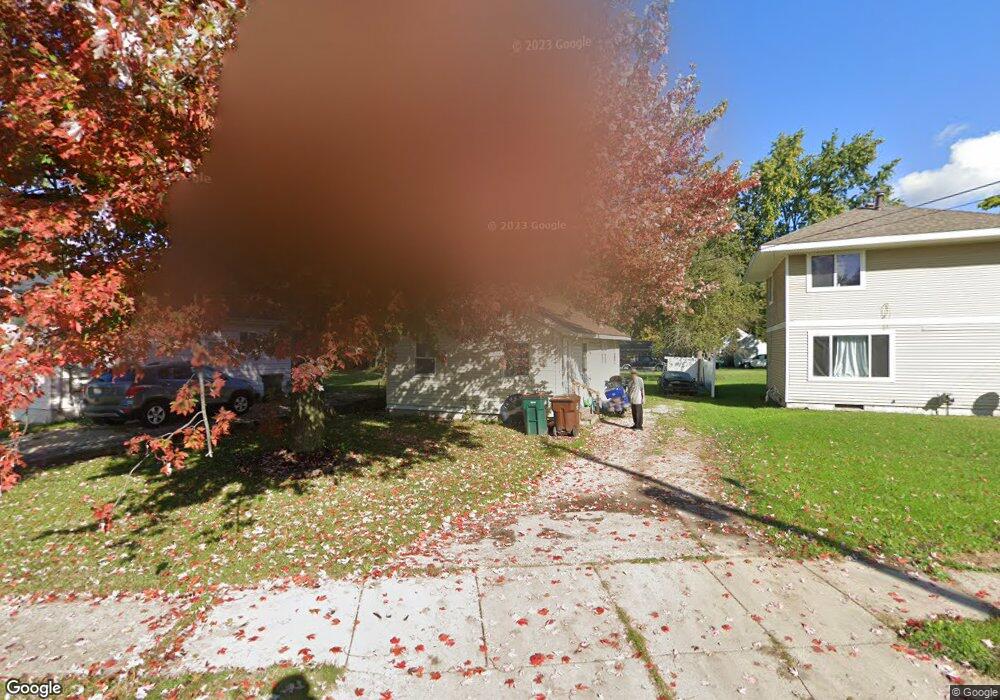
2006 Reo Rd Lansing, MI 48910
Pleasant Grove NeighborhoodEstimated Value: $61,000 - $83,525
2
Beds
1
Bath
698
Sq Ft
$97/Sq Ft
Est. Value
About This Home
This home is located at 2006 Reo Rd, Lansing, MI 48910 and is currently estimated at $67,381, approximately $96 per square foot. 2006 Reo Rd is a home located in Ingham County with nearby schools including Reo Elementary School, Attwood School, and Everett High School.
Ownership History
Date
Name
Owned For
Owner Type
Purchase Details
Closed on
Jun 28, 2025
Sold by
Addiss Jon W
Bought by
Dilts William J and Dilts Amber A
Current Estimated Value
Home Financials for this Owner
Home Financials are based on the most recent Mortgage that was taken out on this home.
Original Mortgage
$45,000
Outstanding Balance
$44,924
Interest Rate
6.89%
Mortgage Type
New Conventional
Estimated Equity
$22,457
Purchase Details
Closed on
Sep 4, 2008
Sold by
Us Bank National Association
Bought by
Addiss Jon
Purchase Details
Closed on
May 3, 2007
Sold by
Jones Kris and Jones Rachel
Bought by
U S Bank Na and Structured Asset Investment Loan Trust 2
Purchase Details
Closed on
Feb 21, 2006
Sold by
Deehan & Burch Llc
Bought by
Jones Kris
Home Financials for this Owner
Home Financials are based on the most recent Mortgage that was taken out on this home.
Original Mortgage
$67,500
Interest Rate
11.15%
Mortgage Type
Purchase Money Mortgage
Purchase Details
Closed on
Apr 29, 2005
Sold by
Suttles Lillie
Bought by
Citifinancial Mortgage Co Inc
Purchase Details
Closed on
Apr 17, 2001
Sold by
First National Acceptance Company
Bought by
Associates Financial Services Co Inc
Purchase Details
Closed on
Jul 29, 1999
Sold by
Peters Edward A and Peters Sara Jane
Bought by
Oberry Scott
Purchase Details
Closed on
Jun 24, 1999
Sold by
Oberry Scott
Bought by
First National Acceptance Company
Purchase Details
Closed on
Feb 21, 1997
Sold by
Peters Edward A and Jane Sara
Bought by
Oberry Scott
Create a Home Valuation Report for This Property
The Home Valuation Report is an in-depth analysis detailing your home's value as well as a comparison with similar homes in the area
Home Values in the Area
Average Home Value in this Area
Purchase History
| Date | Buyer | Sale Price | Title Company |
|---|---|---|---|
| Dilts William J | $60,000 | None Listed On Document | |
| Addiss Jon | $9,500 | Attorneys Title Agency Llc | |
| U S Bank Na | $72,314 | None Available | |
| Jones Kris | $75,000 | Devon Title | |
| Citifinancial Mortgage Co Inc | -- | -- | |
| Associates Financial Services Co Inc | $32,500 | -- | |
| Oberry Scott | $17,000 | -- | |
| First National Acceptance Company | -- | -- | |
| Oberry Scott | $17,000 | -- | |
| O'Berry Scott | $17,000 | -- |
Source: Public Records
Mortgage History
| Date | Status | Borrower | Loan Amount |
|---|---|---|---|
| Open | Dilts William J | $45,000 | |
| Previous Owner | Jones Kris | $67,500 |
Source: Public Records
Tax History
| Year | Tax Paid | Tax Assessment Tax Assessment Total Assessment is a certain percentage of the fair market value that is determined by local assessors to be the total taxable value of land and additions on the property. | Land | Improvement |
|---|---|---|---|---|
| 2025 | $1,679 | $33,500 | $4,300 | $29,200 |
| 2024 | $13 | $26,900 | $4,300 | $22,600 |
| 2023 | $1,576 | $23,400 | $4,300 | $19,100 |
| 2022 | $1,106 | $22,000 | $4,300 | $17,700 |
| 2021 | $1,371 | $20,300 | $3,000 | $17,300 |
| 2020 | $5,559 | $19,000 | $3,000 | $16,000 |
| 2019 | $4,939 | $18,100 | $3,000 | $15,100 |
| 2018 | $3,779 | $15,100 | $3,000 | $12,100 |
| 2017 | $1,349 | $15,100 | $3,000 | $12,100 |
| 2016 | $900 | $11,400 | $3,000 | $8,400 |
| 2015 | $900 | $11,100 | $6,067 | $5,033 |
| 2014 | $900 | $11,200 | $8,090 | $3,110 |
Source: Public Records
Map
Nearby Homes
- 1941 Reo Rd
- 1729 Reo Rd
- 4927 Starr Ave
- 4928 Hughes Rd
- 2105 Mary Ave
- 5017 Christiansen Rd
- 1808 W Jolly Rd
- 1420 Reo Rd
- 1429 Pierce Rd
- 0 Midwood St
- 1904 Hillcrest St
- 1715 Hillcrest St
- 2416 Midwood St
- VL Hillcrest St
- 1301 S Briarfield Dr
- 2820 Reo Rd
- 2706 W Jolly Rd
- 1215 S Briarfield Dr
- 1319 Hillcrest St
- 2918 Midwood St
Your Personal Tour Guide
Ask me questions while you tour the home.