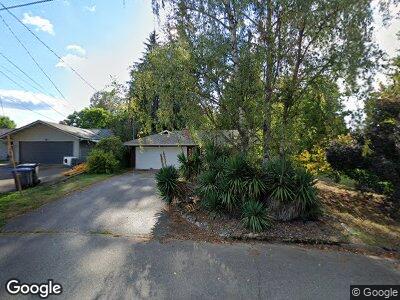
2006 SE Juniper Ct Port Orchard, WA 98366
Parkwood NeighborhoodEstimated Value: $524,000 - $614,000
4
Beds
2
Baths
2,932
Sq Ft
$198/Sq Ft
Est. Value
About This Home
This home is located at 2006 SE Juniper Ct, Port Orchard, WA 98366 and is currently estimated at $579,801, approximately $197 per square foot. 2006 SE Juniper Ct is a home located in Kitsap County with nearby schools including Orchard Heights Elementary School, Marcus Whitman Middle School, and South Kitsap High School.
Ownership History
Date
Name
Owned For
Owner Type
Purchase Details
Closed on
May 17, 2011
Sold by
Lewis Dona Eileen
Bought by
Lewis Daniel Mark
Current Estimated Value
Purchase Details
Closed on
Oct 18, 2001
Sold by
Martinez Richard and Martinez Shirley A
Bought by
Lewis Daniel M and Lewis Dona E
Home Financials for this Owner
Home Financials are based on the most recent Mortgage that was taken out on this home.
Original Mortgage
$143,200
Interest Rate
6.87%
Purchase Details
Closed on
Mar 9, 2000
Sold by
Martinez Richard
Bought by
Martinez Richard and Martinez Shirley A
Home Financials for this Owner
Home Financials are based on the most recent Mortgage that was taken out on this home.
Original Mortgage
$78,300
Interest Rate
8.27%
Create a Home Valuation Report for This Property
The Home Valuation Report is an in-depth analysis detailing your home's value as well as a comparison with similar homes in the area
Home Values in the Area
Average Home Value in this Area
Purchase History
| Date | Buyer | Sale Price | Title Company |
|---|---|---|---|
| Lewis Daniel Mark | -- | None Available | |
| Lewis Daniel M | $179,000 | First American Title Ins Co | |
| Martinez Richard | -- | Land Title Company |
Source: Public Records
Mortgage History
| Date | Status | Borrower | Loan Amount |
|---|---|---|---|
| Open | Lewis Daniel Mark | $213,900 | |
| Previous Owner | Lewis Daniel M | $223,750 | |
| Previous Owner | Lewis Daniel M | $221,000 | |
| Previous Owner | Lewis Daniel M | $143,375 | |
| Previous Owner | Lewis Daniel M | $67,200 | |
| Previous Owner | Lewis Daniel M | $143,200 | |
| Previous Owner | Martinez Richard | $78,300 | |
| Closed | Lewis Daniel M | $35,800 |
Source: Public Records
Tax History Compared to Growth
Tax History
| Year | Tax Paid | Tax Assessment Tax Assessment Total Assessment is a certain percentage of the fair market value that is determined by local assessors to be the total taxable value of land and additions on the property. | Land | Improvement |
|---|---|---|---|---|
| 2025 | $4,816 | $551,160 | $66,560 | $484,600 |
| 2024 | $4,670 | $551,160 | $66,560 | $484,600 |
| 2023 | $4,639 | $551,160 | $66,560 | $484,600 |
| 2022 | $4,524 | $450,290 | $62,160 | $388,130 |
| 2021 | $4,418 | $416,060 | $57,760 | $358,300 |
| 2020 | $4,343 | $397,440 | $55,010 | $342,430 |
| 2019 | $3,618 | $362,910 | $54,030 | $308,880 |
| 2018 | $3,757 | $290,130 | $54,030 | $236,100 |
| 2017 | $3,191 | $290,130 | $54,030 | $236,100 |
| 2016 | $3,095 | $257,330 | $54,030 | $203,300 |
| 2015 | $2,991 | $251,980 | $54,030 | $197,950 |
| 2014 | -- | $246,630 | $54,030 | $192,600 |
| 2013 | -- | $239,030 | $56,880 | $182,150 |
Source: Public Records
Map
Nearby Homes
- 1978 Kelowna Place Southest
- 2453 Parkwood Dr SE
- 2523 Jackson Ave SE
- 2457 White Cedar Dr SE
- 3900 SE Mile Hill Dr
- 3930 SE Mile Hill Dr
- 2979 SE Mile Hill Dr Unit F4
- 2949 SE Mile Hill Dr Unit C7
- 2541 Red Spruce Dr SE
- 1350 Holmes Ave SE
- 3299 Madrona Dr SE
- 3799 SE Horstman Rd
- 0 Lincoln Ave SE
- 2893 Maple Crest Ln SE
- 1330 Marlin Dr SE
- 2240 Ponderosa Dr SE
- 1359 Marlin Dr SE
- 691 SE Olga Cir
- 2330 Lapush Ave SE
- 3105 SE Summer Place
- 2006 SE Juniper Ct
- 2010 SE Juniper Ct
- 3332 SE Pine Tree Dr
- 3348 SE Pine Tree Dr
- 3333 SE Tamarack Dr
- 3353 SE Tamarack Dr
- 1998 SE Juniper Ct
- 3368 SE Pine Tree Dr
- 3320 Pine Tree Dr SE
- 3307 SE Pine Tree Dr
- 3375 SE Tamarack Dr
- 2014 SE Juniper Ct
- 2003 SE Juniper Ct
- 2013 SE Juniper Ct
- 3390 SE Pine Tree Dr
- 3397 SE Tamarack Dr
- 1994 SE Juniper Ct
- 1993 SE Juniper Ct
- 3335 SE Pine Tree Dr
- 3317 SE Pine Tree Dr