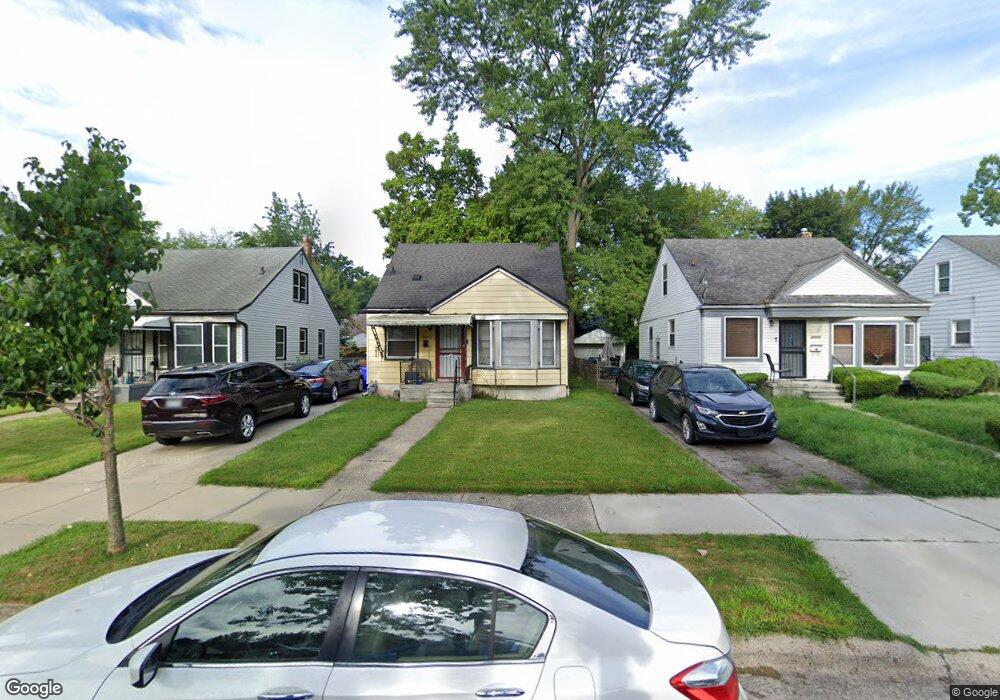
20067 Chapel St Detroit, MI 48219
Evergreen Lahser NeighborhoodEstimated Value: $90,000 - $141,000
3
Beds
1
Bath
800
Sq Ft
$133/Sq Ft
Est. Value
About This Home
This home is located at 20067 Chapel St, Detroit, MI 48219 and is currently estimated at $106,680, approximately $133 per square foot. 20067 Chapel St is a home located in Wayne County with nearby schools including Ralph W. Emerson Elementary-Middle School, Charles L. Spain Elementary-Middle School, and Edward 'Duke' Ellington Conservatory of Music and Art.
Ownership History
Date
Name
Owned For
Owner Type
Purchase Details
Closed on
Jun 25, 2020
Sold by
Belmont Properties Of Detroit Mi Inc
Bought by
Haigler Rhashandra and Haigler George
Current Estimated Value
Purchase Details
Closed on
Feb 27, 2015
Sold by
Belmont Properties Of Detroit Michigan I
Bought by
Haigler Rhashandra
Purchase Details
Closed on
Jan 31, 2014
Sold by
Zeheria Pete
Bought by
Belmont Properties Of Michigan
Purchase Details
Closed on
Nov 7, 2013
Sold by
Wayne County Treasurer
Bought by
Zeheria Pete
Purchase Details
Closed on
Feb 19, 2009
Sold by
Trott & Trott Pc
Bought by
Mosley Arbie and Mosley Alida
Purchase Details
Closed on
Jun 26, 2008
Sold by
Citimortgage Inc
Bought by
Federal National Mortgage Association
Purchase Details
Closed on
Oct 31, 2007
Sold by
Hargrove Phillip
Bought by
Adapt Property 2 Llc
Create a Home Valuation Report for This Property
The Home Valuation Report is an in-depth analysis detailing your home's value as well as a comparison with similar homes in the area
Home Values in the Area
Average Home Value in this Area
Purchase History
| Date | Buyer | Sale Price | Title Company |
|---|---|---|---|
| Haigler Rhashandra | -- | None Available | |
| Haigler Rhashandra | -- | None Available | |
| Belmont Properties Of Michigan | -- | None Available | |
| Zeheria Pete | $3,400 | None Available | |
| Mosley Arbie | $2,400 | Warranty Title Agency Llc | |
| Federal National Mortgage Association | -- | None Available | |
| Citimortgage Inc | $99,365 | None Available | |
| Adapt Property 2 Llc | -- | None Available |
Source: Public Records
Tax History Compared to Growth
Tax History
| Year | Tax Paid | Tax Assessment Tax Assessment Total Assessment is a certain percentage of the fair market value that is determined by local assessors to be the total taxable value of land and additions on the property. | Land | Improvement |
|---|---|---|---|---|
| 2025 | $927 | $44,400 | $0 | $0 |
| 2024 | $927 | $38,600 | $0 | $0 |
| 2023 | $898 | $30,400 | $0 | $0 |
| 2022 | $976 | $24,500 | $0 | $0 |
| 2021 | $251 | $0 | $0 | $0 |
| 2020 | $944 | $17,600 | $0 | $0 |
| 2019 | $931 | $13,900 | $0 | $0 |
| 2018 | $804 | $11,900 | $0 | $0 |
| 2017 | $178 | $9,400 | $0 | $0 |
| 2016 | $905 | $11,000 | $0 | $0 |
| 2015 | $1,100 | $11,000 | $0 | $0 |
| 2013 | $1,377 | $13,772 | $0 | $0 |
| 2010 | -- | $20,192 | $1,018 | $19,174 |
Source: Public Records
Map
Nearby Homes
- 19957 Chapel St
- 20116 Greydale Ave
- 20019 Westbrook St
- 20266 Greydale Ave
- 20274 Greydale Ave
- 20220 Lahser Rd
- 20290 Greydale Ave
- 20267 Greydale Ave
- 20317 Bentler St
- 20308 Greydale Ave
- 20266 Lahser Rd
- 20101 Lahser Rd
- 19790 Lahser Rd
- 19926 Blackstone St
- 19950 Houghton St
- 19734 Westbrook St
- 19712 Lahser Rd
- 20550 Blackstone Ct
- 19500 Lahser Rd
- 20240 Burt Rd
- 20061 Chapel St
- 20075 Chapel St
- 20051 Chapel St
- 20083 Chapel St
- 20045 Chapel St
- 20091 Chapel St
- 20068 Burgess
- 20076 Burgess
- 20060 Burgess
- 20101 Chapel St
- 20101 Chapel St
- 20084 Burgess
- 20050 Burgess
- 20035 Chapel St
- 20090 Burgess
- 20044 Burgess
- 20066 Chapel St
- 20074 Chapel St
- 20058 Chapel St
- 20027 Chapel St