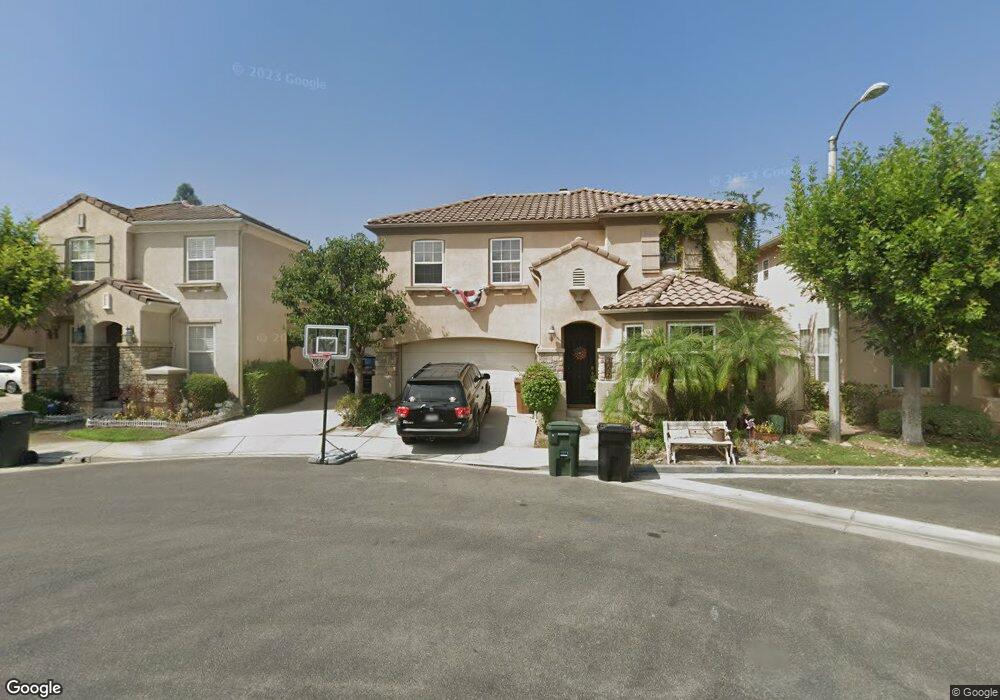
2007 Ford Ln Placentia, CA 92870
Estimated Value: $947,000 - $1,232,000
3
Beds
2
Baths
2,386
Sq Ft
$445/Sq Ft
Est. Value
About This Home
This home is located at 2007 Ford Ln, Placentia, CA 92870 and is currently estimated at $1,061,110, approximately $444 per square foot. 2007 Ford Ln is a home located in Orange County with nearby schools including Glenview Elementary School, Bernardo Yorba Middle School, and Friends Christian School.
Ownership History
Date
Name
Owned For
Owner Type
Purchase Details
Closed on
Mar 17, 2021
Sold by
Futterer Rebekah S
Bought by
Futterer Robert S
Current Estimated Value
Home Financials for this Owner
Home Financials are based on the most recent Mortgage that was taken out on this home.
Original Mortgage
$314,000
Outstanding Balance
$281,479
Interest Rate
2.7%
Mortgage Type
New Conventional
Estimated Equity
$779,631
Purchase Details
Closed on
Oct 15, 2019
Sold by
Futterer David L
Bought by
Futterer Rebekah S
Purchase Details
Closed on
Jan 23, 2004
Sold by
Futterer David L and Ford Rebekah S
Bought by
Futterer David L and Futterer Rebekah S
Home Financials for this Owner
Home Financials are based on the most recent Mortgage that was taken out on this home.
Original Mortgage
$428,000
Interest Rate
4.75%
Mortgage Type
New Conventional
Create a Home Valuation Report for This Property
The Home Valuation Report is an in-depth analysis detailing your home's value as well as a comparison with similar homes in the area
Home Values in the Area
Average Home Value in this Area
Purchase History
| Date | Buyer | Sale Price | Title Company |
|---|---|---|---|
| Futterer Robert S | -- | Wfg National Title Company | |
| Futterer Rebekah S | -- | None Available | |
| Futterer David L | -- | Security Union Title |
Source: Public Records
Mortgage History
| Date | Status | Borrower | Loan Amount |
|---|---|---|---|
| Open | Futterer Robert S | $314,000 | |
| Previous Owner | Futterer David L | $428,000 | |
| Closed | Futterer David L | $53,500 |
Source: Public Records
Tax History
| Year | Tax Paid | Tax Assessment Tax Assessment Total Assessment is a certain percentage of the fair market value that is determined by local assessors to be the total taxable value of land and additions on the property. | Land | Improvement |
|---|---|---|---|---|
| 2025 | $7,593 | $630,001 | $249,735 | $380,266 |
| 2024 | $7,593 | $617,649 | $244,839 | $372,810 |
| 2023 | $7,427 | $605,539 | $240,039 | $365,500 |
| 2022 | $7,313 | $593,666 | $235,332 | $358,334 |
| 2021 | $7,135 | $582,026 | $230,718 | $351,308 |
| 2020 | $6,967 | $576,059 | $228,353 | $347,706 |
| 2019 | $6,690 | $564,764 | $223,875 | $340,889 |
| 2018 | $6,603 | $553,691 | $219,486 | $334,205 |
| 2017 | $6,491 | $542,835 | $215,183 | $327,652 |
| 2016 | $6,361 | $532,192 | $210,964 | $321,228 |
| 2015 | $6,279 | $524,198 | $207,795 | $316,403 |
| 2014 | $6,100 | $513,930 | $203,724 | $310,206 |
Source: Public Records
Map
Nearby Homes
- 2067 Bay Meadows Dr
- 1780 N Azure St
- 180 Horseshoe Dr
- 6052 Candle Light Ln
- 159 Los Alamitos Cir
- 1963 Avenida Del Sol
- 5981 Lakeview Ave
- 1971 Avenida Del Sol
- 1954 Avenida Del Sol
- 1968 Via de la Luna
- 1952 Avenida Del Sol
- 6071 Sun View Rd
- 17792 Neff Ranch Rd
- 17722 Neff Ranch Rd
- 6012 Richfield Rd
- 18313 Wedgewood Dr
- 18501 Woodwind Ln
- 4926 E Glenview Ave
- 17752 Ridgecrest Dr
- 4924 E Budlong St
- 2007 Ford Ln Unit 10
- 2013 Ford Place
- 2013 Ford Place
- 2001 Ford Ln Unit 9
- 130 Tanforan Ave
- 2036 Tanforan Ave
- 136 Tanforan Ave
- 2006 Ford Ln
- 2012 Ford Ln
- 2018 Ford Ln
- 2030 Tanforan Ave
- 2031 Ford Place
- 2031 Ford Place
- 2024 Ford Ln Unit 14
- 2030 Ford Ln Unit 15
- 142 Tanforan Ave
- 2025 Ford Place
- 2037 Ford Ln
- 2037 Ford Place Unit 3
- 2049 Ford Ln
Your Personal Tour Guide
Ask me questions while you tour the home.