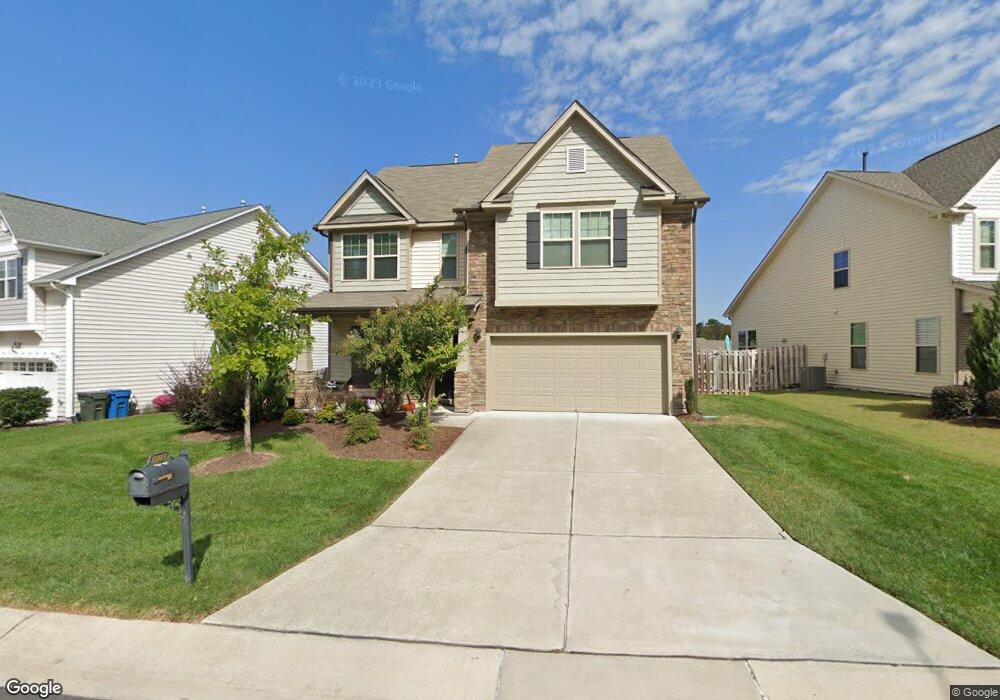
2007 Morehead Hill Ct Unit Lot 401 Durham, NC 27703
Eastern Durham NeighborhoodEstimated Value: $494,299 - $574,000
3
Beds
3
Baths
2,357
Sq Ft
$224/Sq Ft
Est. Value
About This Home
This home is located at 2007 Morehead Hill Ct Unit Lot 401, Durham, NC 27703 and is currently estimated at $529,075, approximately $224 per square foot. 2007 Morehead Hill Ct Unit Lot 401 is a home located in Durham County with nearby schools including Spring Valley Elementary School, John W Neal Middle School, and Southern School of Energy & Sustainability.
Ownership History
Date
Name
Owned For
Owner Type
Purchase Details
Closed on
Feb 7, 2024
Sold by
Herman Lauren L and Bell Lauren Lavane
Bought by
Bell Bradley Scott and Bell Lauren Lavane
Current Estimated Value
Home Financials for this Owner
Home Financials are based on the most recent Mortgage that was taken out on this home.
Original Mortgage
$65,000
Interest Rate
6.88%
Mortgage Type
New Conventional
Purchase Details
Closed on
Dec 29, 2016
Sold by
Dan Ryan Builders North Ca
Bought by
Herman Lauren L and Herman Wilda K
Home Financials for this Owner
Home Financials are based on the most recent Mortgage that was taken out on this home.
Original Mortgage
$257,820
Interest Rate
4.08%
Mortgage Type
New Conventional
Purchase Details
Closed on
Jul 15, 2016
Sold by
Ghd Brightleaf Llc
Bought by
Dan Ryan Builders North Caroli
Create a Home Valuation Report for This Property
The Home Valuation Report is an in-depth analysis detailing your home's value as well as a comparison with similar homes in the area
Home Values in the Area
Average Home Value in this Area
Purchase History
| Date | Buyer | Sale Price | Title Company |
|---|---|---|---|
| Bell Bradley Scott | -- | None Listed On Document | |
| Herman Lauren L | $286,500 | -- | |
| Dan Ryan Builders North Caroli | $510,000 | -- |
Source: Public Records
Mortgage History
| Date | Status | Borrower | Loan Amount |
|---|---|---|---|
| Previous Owner | Bell Bradley Scott | $65,000 | |
| Previous Owner | Herman Lauren L | $257,820 |
Source: Public Records
Tax History Compared to Growth
Tax History
| Year | Tax Paid | Tax Assessment Tax Assessment Total Assessment is a certain percentage of the fair market value that is determined by local assessors to be the total taxable value of land and additions on the property. | Land | Improvement |
|---|---|---|---|---|
| 2025 | $4,010 | $525,182 | $103,545 | $421,637 |
| 2024 | $4,010 | $287,454 | $61,215 | $226,239 |
| 2023 | $3,765 | $287,454 | $61,215 | $226,239 |
| 2022 | $3,679 | $287,454 | $61,215 | $226,239 |
| 2021 | $3,662 | $287,454 | $61,215 | $226,239 |
| 2020 | $3,576 | $287,454 | $61,215 | $226,239 |
| 2019 | $3,576 | $287,454 | $61,215 | $226,239 |
| 2018 | $3,839 | $282,994 | $58,300 | $224,694 |
| 2017 | $3,482 | $258,584 | $58,300 | $200,284 |
| 2016 | $759 | $58,300 | $58,300 | $0 |
| 2015 | $85 | $6,164 | $6,164 | $0 |
| 2014 | $85 | $61,641 | $61,641 | $0 |
Source: Public Records
Map
Nearby Homes
- 2018 Morehead Hill Ct
- 204 Irving Way
- 14 Prairie View Ct
- 205 Spring Flower Ln
- 408 Timpson Ave
- 1605 Morehead Hill Ct
- 2815 Mebane Ln
- 1602 Eagle Lodge Ln
- 1006 Red Rock Dr
- 4 Seawell Ct
- 1017 Constellation Cir
- 3338 Prospect Pkwy
- Coleman Plan at Stella View - Ardmore Collection
- Tryon III Plan at Stella View - Summit Collection
- Mayflower III Plan at Stella View - Summit Collection
- Landrum III Plan at Stella View - Summit Collection
- 1106 Constellation Cir
- 1102 Constellation Cir
- 1307 Cosmic Dr
- 140 Token House Rd
- 2007 Morehead Hill Ct
- 2009 Morehead Hill Ct
- 2009 Morehead Hill Ct Unit 400
- 2005 Morehead Hill Ct
- 2005 Morehead Hill Ct
- 2005 Morehead Hill Ct
- 2005 Morehead Hill Ct
- 2011 Morehead Hill Ct Unit 399
- 2001 Morehead Hill Ct
- 2606 Teermark Ln
- 2606 Teermark Ln Unit 405
- 2013 Morehead Hill Ct
- 2008 Morehead Hill Ct
- 2008 Morehead Hill Ct Unit Lot 386
- 2010 Morehead Hill Ct Unit 387
- 2006 Morehead Hill Ct Unit 385
- 2006 Morehead Hill Ct
- 2608 Teermark Ln Unit 406
- 2012 Morehead Hill Ct
- 2004 Morehead Hill Ct