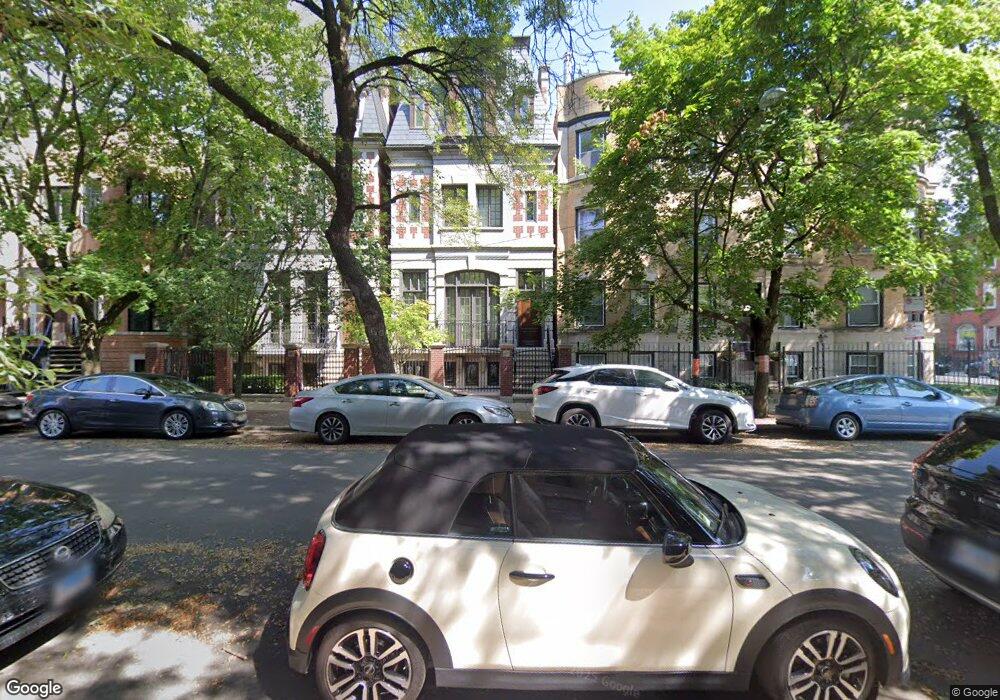
2007 N Howe St Chicago, IL 60614
Lincoln Park NeighborhoodEstimated Value: $3,427,000 - $5,232,000
7
Beds
6
Baths
6,500
Sq Ft
$643/Sq Ft
Est. Value
About This Home
This home is located at 2007 N Howe St, Chicago, IL 60614 and is currently estimated at $4,176,960, approximately $642 per square foot. 2007 N Howe St is a home located in Cook County with nearby schools including Abraham Lincoln Elementary School, Lincoln Park High School, and St. James Lutheran School.
Ownership History
Date
Name
Owned For
Owner Type
Purchase Details
Closed on
Jul 12, 2007
Sold by
2007 Howe Development Co Llc
Bought by
Satpathy Aurobind and Satpathy Kaveri
Current Estimated Value
Home Financials for this Owner
Home Financials are based on the most recent Mortgage that was taken out on this home.
Original Mortgage
$2,520,000
Outstanding Balance
$1,573,299
Interest Rate
6.75%
Mortgage Type
Unknown
Estimated Equity
$2,603,661
Purchase Details
Closed on
Jun 10, 2005
Sold by
Lasalle Street Properties Llc
Bought by
2007 Howe Development Co Llc
Home Financials for this Owner
Home Financials are based on the most recent Mortgage that was taken out on this home.
Original Mortgage
$2,096,208
Interest Rate
6%
Mortgage Type
Construction
Create a Home Valuation Report for This Property
The Home Valuation Report is an in-depth analysis detailing your home's value as well as a comparison with similar homes in the area
Home Values in the Area
Average Home Value in this Area
Purchase History
| Date | Buyer | Sale Price | Title Company |
|---|---|---|---|
| Satpathy Aurobind | $3,150,000 | Ctic | |
| 2007 Howe Development Co Llc | -- | Multiple | |
| Lasalle Street Properties Llc | -- | Multiple |
Source: Public Records
Mortgage History
| Date | Status | Borrower | Loan Amount |
|---|---|---|---|
| Open | Satpathy Aurobind | $2,520,000 | |
| Previous Owner | 2007 Howe Development Co Llc | $2,096,208 |
Source: Public Records
Tax History
| Year | Tax Paid | Tax Assessment Tax Assessment Total Assessment is a certain percentage of the fair market value that is determined by local assessors to be the total taxable value of land and additions on the property. | Land | Improvement |
|---|---|---|---|---|
| 2025 | $66,186 | $292,273 | $46,314 | $245,959 |
| 2024 | $66,186 | $292,273 | $46,314 | $245,959 |
| 2023 | $64,521 | $313,692 | $37,350 | $276,342 |
| 2022 | $64,521 | $313,692 | $37,350 | $276,342 |
| 2021 | $63,081 | $313,692 | $37,350 | $276,342 |
| 2020 | $54,784 | $245,924 | $32,868 | $213,056 |
| 2019 | $53,706 | $267,309 | $32,868 | $234,441 |
| 2018 | $52,803 | $267,309 | $32,868 | $234,441 |
| 2017 | $53,910 | $250,430 | $26,892 | $223,538 |
| 2016 | $54,199 | $270,603 | $26,892 | $243,711 |
| 2015 | $49,587 | $270,603 | $26,892 | $243,711 |
| 2014 | $43,104 | $232,320 | $20,916 | $211,404 |
| 2013 | $42,253 | $232,320 | $20,916 | $211,404 |
Source: Public Records
Map
Nearby Homes
- 604 W Armitage Ave
- 1942 N Orchard St Unit 3N
- 1942 N Orchard St Unit 2
- 1910 N Larrabee St Unit 1910
- 1940 N Mohawk St Unit 1
- 1878 N Orchard St
- 2140 N Lincoln Ave Unit 5306
- 1865 N Burling St
- 1853 N Burling St
- 530 W Dickens Ave Unit 401
- 1849 N Mohawk St Unit 1
- 1910 N Halsted St Unit 1S
- 1867 N Halsted St Unit 2S
- 1921 N Dayton St
- 2131 N Larrabee St Unit 6307
- 1838 N Burling St
- 1851 N Halsted St Unit 2
- 1938 N Hudson Ave
- 1811 N Howe St
- 430 W Armitage Ave Unit D105
- 2009 N Howe St
- 2003 N Howe St Unit 20033
- 2003 N Howe St Unit 20032
- 2003 N Howe St Unit 20031
- 2003 N Howe St Unit 3N
- 2001 N Howe St Unit 3S
- 2001 N Howe St Unit 20013
- 2001 N Howe St Unit 20011
- 2001 N Howe St Unit 20012
- 2011 N Howe St
- 2011 N Howe St
- 2013 N Howe St
- 608 W Armitage Ave Unit A1
- 608 W Armitage Ave Unit A2
- 2018 N Larrabee St
- 2019 N Howe St Unit 1
- 2020 N Larrabee St
- 606 W Armitage Ave
- 2024 N Larrabee St
- 621 W Armitage Ave
Your Personal Tour Guide
Ask me questions while you tour the home.