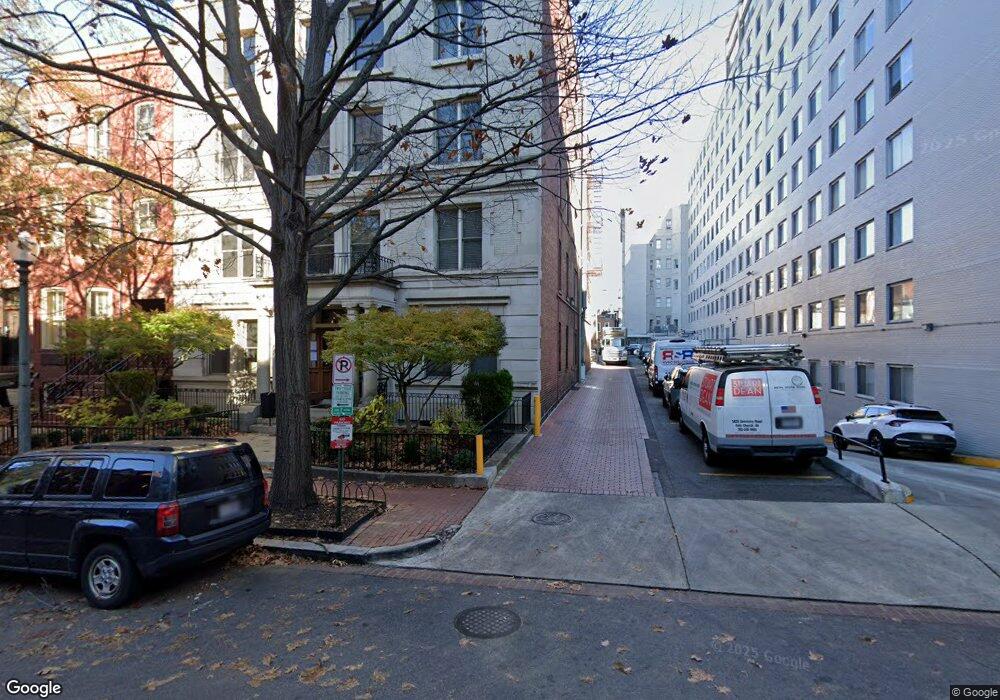
2007 O St NW Unit 403 Washington, DC 20036
Dupont Circle NeighborhoodEstimated Value: $296,139 - $347,000
1
Bed
1
Bath
405
Sq Ft
$802/Sq Ft
Est. Value
About This Home
This home is located at 2007 O St NW Unit 403, Washington, DC 20036 and is currently estimated at $324,713, approximately $801 per square foot. 2007 O St NW Unit 403 is a home located in District of Columbia with nearby schools including School Without Walls @ Francis-Stevens, Cardozo Education Campus, and St. Augustine School.
Ownership History
Date
Name
Owned For
Owner Type
Purchase Details
Closed on
Sep 23, 2020
Sold by
Vonritter Konrad and Figueres Christiana
Bought by
Nala Enterprises Llc
Current Estimated Value
Purchase Details
Closed on
Oct 21, 2003
Sold by
Mastruzzi Massimo
Bought by
Figueres Christiana and Von Ritter Konrad
Home Financials for this Owner
Home Financials are based on the most recent Mortgage that was taken out on this home.
Original Mortgage
$168,000
Interest Rate
6.43%
Mortgage Type
New Conventional
Purchase Details
Closed on
Aug 5, 2002
Sold by
Wyatt Jacob
Bought by
Mastruzzi Marssimo and Saavedra Jorge
Home Financials for this Owner
Home Financials are based on the most recent Mortgage that was taken out on this home.
Original Mortgage
$117,900
Interest Rate
6.64%
Purchase Details
Closed on
Jan 19, 1996
Sold by
Sforza Scott N
Bought by
Wyatt Jacob R
Home Financials for this Owner
Home Financials are based on the most recent Mortgage that was taken out on this home.
Original Mortgage
$49,500
Interest Rate
7.16%
Create a Home Valuation Report for This Property
The Home Valuation Report is an in-depth analysis detailing your home's value as well as a comparison with similar homes in the area
Home Values in the Area
Average Home Value in this Area
Purchase History
| Date | Buyer | Sale Price | Title Company |
|---|---|---|---|
| Nala Enterprises Llc | $309,880 | None Available | |
| Figueres Christiana | $210,000 | -- | |
| Mastruzzi Marssimo | $131,000 | -- | |
| Wyatt Jacob R | $55,000 | -- |
Source: Public Records
Mortgage History
| Date | Status | Borrower | Loan Amount |
|---|---|---|---|
| Previous Owner | Figueres Christiana | $168,000 | |
| Previous Owner | Mastruzzi Marssimo | $117,900 | |
| Previous Owner | Wyatt Jacob R | $49,500 |
Source: Public Records
Tax History
| Year | Tax Paid | Tax Assessment Tax Assessment Total Assessment is a certain percentage of the fair market value that is determined by local assessors to be the total taxable value of land and additions on the property. | Land | Improvement |
|---|---|---|---|---|
| 2025 | $2,464 | $305,490 | $91,650 | $213,840 |
| 2024 | $2,460 | $304,580 | $91,370 | $213,210 |
| 2023 | $2,538 | $313,280 | $93,980 | $219,300 |
| 2022 | $2,409 | $297,180 | $89,150 | $208,030 |
| 2021 | $2,438 | $300,090 | $90,030 | $210,060 |
| 2020 | $2,634 | $309,880 | $92,960 | $216,920 |
| 2019 | $2,524 | $296,890 | $89,070 | $207,820 |
| 2017 | $2,423 | $285,070 | $0 | $0 |
| 2016 | $2,432 | $286,080 | $0 | $0 |
Source: Public Records
Map
Nearby Homes
- 1409 Hopkins St NW
- 2012 O St NW Unit 12
- 1330 New Hampshire Ave NW Unit 5
- 1330 New Hampshire Ave NW Unit 720
- 1330 New Hampshire Ave NW Unit 1014
- 1330 New Hampshire Ave NW Unit 911
- 1330 New Hampshire Ave NW Unit 215
- 2000 Massachusetts Ave NW
- 2002 Massachusetts Ave NW Unit R-3
- 1301 20th St NW Unit 316
- 1308 21st St NW Unit 1
- 2132 Newport Place NW
- 2021 Q St NW
- 2142 O St NW Unit 100
- 2141 P St NW Unit 202
- 2141 P St NW Unit 26
- 1280 21st St NW Unit 109
- 1260 21st St NW Unit 1004
- 1260 21st St NW Unit 8
- 1260 21st St NW Unit 207
- 2007 O St NW Unit 202
- 2007 O St NW Unit 102
- 2007 O St NW Unit 305
- 2007 O St NW Unit 504
- 2007 O St NW Unit 404
- 2007 O St NW Unit 304
- 2007 O St NW Unit 405
- 2007 O St NW Unit 503
- 2007 O St NW Unit 104
- 2007 O St NW Unit 502
- 2007 O St NW Unit 105
- 2007 O St NW Unit 301
- 2007 O St NW Unit 302
- 2007 O St NW Unit 505
- 2007 O St NW Unit 103
- 2007 O St NW Unit 501
- 2007 O St NW Unit 402
- 2007 O St NW Unit 401
- 2007 O St NW Unit 303
- 2007 O St NW Unit 205
Your Personal Tour Guide
Ask me questions while you tour the home.