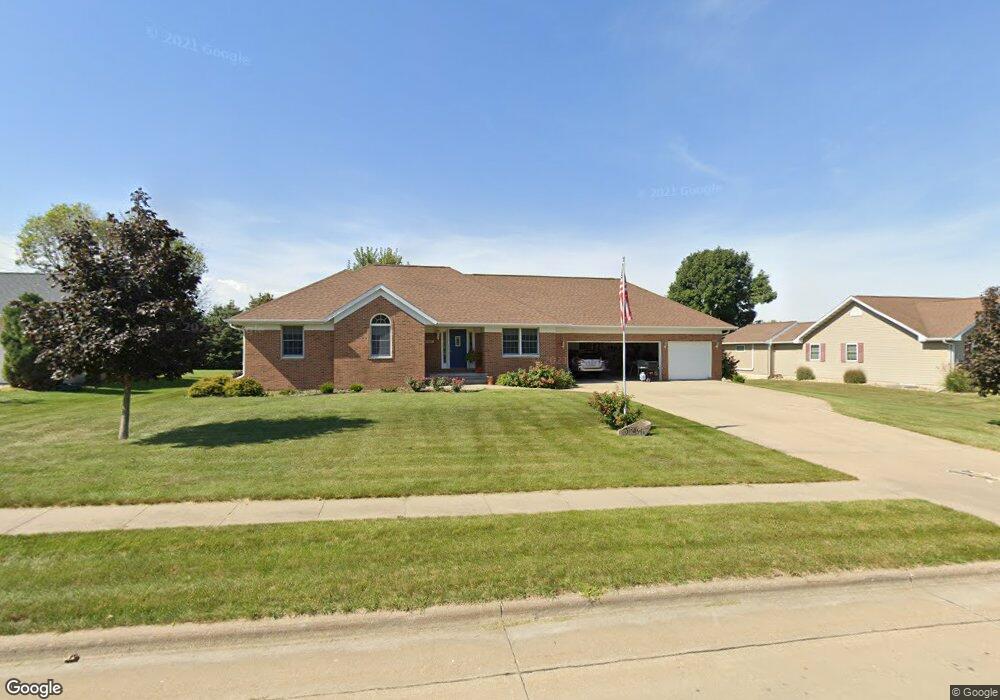
2007 S 1st Ave Vinton, IA 52349
Estimated Value: $383,000 - $430,000
3
Beds
3
Baths
1,814
Sq Ft
$223/Sq Ft
Est. Value
About This Home
This home is located at 2007 S 1st Ave, Vinton, IA 52349 and is currently estimated at $405,307, approximately $223 per square foot. 2007 S 1st Ave is a home located in Benton County with nearby schools including Tilford Elementary School, Shellsburg Elementary School, and Vinton-Shellsburg Middle School.
Ownership History
Date
Name
Owned For
Owner Type
Purchase Details
Closed on
Aug 15, 2022
Sold by
John W Travis Revocable Trust
Bought by
Morrow Brian D
Current Estimated Value
Home Financials for this Owner
Home Financials are based on the most recent Mortgage that was taken out on this home.
Original Mortgage
$362,128
Outstanding Balance
$345,627
Interest Rate
5.3%
Mortgage Type
New Conventional
Estimated Equity
$59,680
Purchase Details
Closed on
Dec 7, 2007
Sold by
Travis John W and Travis Julia A
Bought by
Travis John W and John W Travis Revocable Trust
Create a Home Valuation Report for This Property
The Home Valuation Report is an in-depth analysis detailing your home's value as well as a comparison with similar homes in the area
Home Values in the Area
Average Home Value in this Area
Purchase History
| Date | Buyer | Sale Price | Title Company |
|---|---|---|---|
| Morrow Brian D | $375,000 | -- | |
| Travis John W | -- | None Available |
Source: Public Records
Mortgage History
| Date | Status | Borrower | Loan Amount |
|---|---|---|---|
| Open | Morrow Brian D | $362,128 |
Source: Public Records
Tax History Compared to Growth
Tax History
| Year | Tax Paid | Tax Assessment Tax Assessment Total Assessment is a certain percentage of the fair market value that is determined by local assessors to be the total taxable value of land and additions on the property. | Land | Improvement |
|---|---|---|---|---|
| 2025 | $5,580 | $341,400 | $45,400 | $296,000 |
| 2024 | $5,580 | $316,500 | $44,200 | $272,300 |
| 2023 | $4,976 | $316,500 | $44,200 | $272,300 |
| 2022 | $5,106 | $243,500 | $35,400 | $208,100 |
| 2021 | $5,106 | $243,500 | $35,400 | $208,100 |
| 2020 | $4,840 | $235,800 | $28,800 | $207,000 |
| 2019 | $4,864 | $235,800 | $28,800 | $207,000 |
| 2018 | $4,720 | $233,700 | $28,000 | $205,700 |
| 2017 | $4,532 | $233,700 | $28,000 | $205,700 |
| 2016 | $4,454 | $218,400 | $26,200 | $192,200 |
| 2015 | $4,454 | $218,400 | $26,200 | $192,200 |
| 2014 | $4,524 | $221,200 | $0 | $0 |
Source: Public Records
Map
Nearby Homes