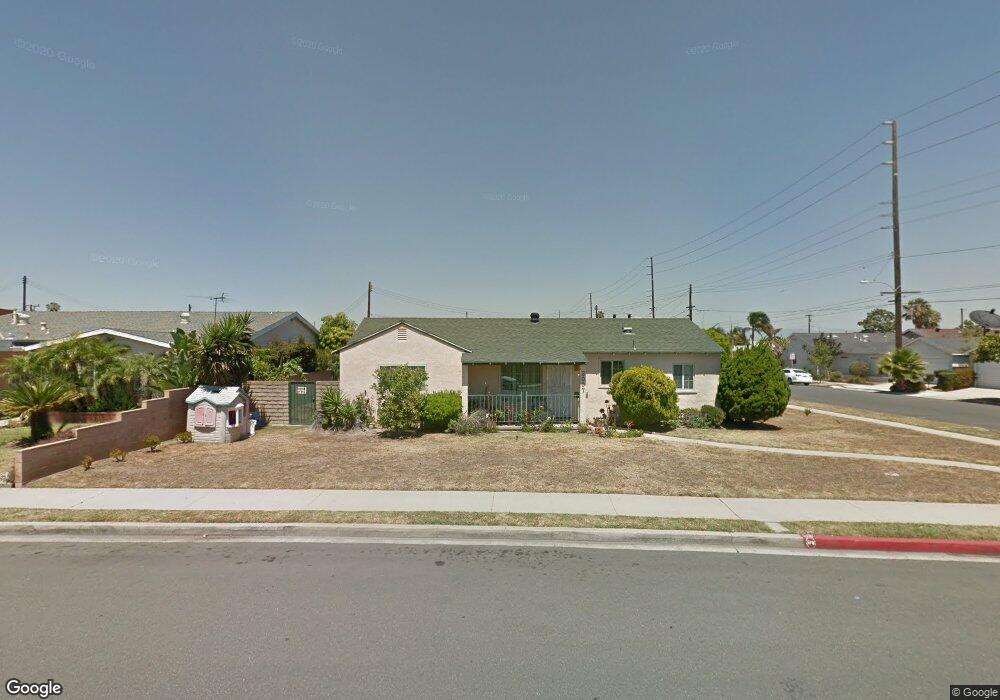
2007 W 149th St Gardena, CA 90249
Estimated Value: $827,000 - $945,000
3
Beds
2
Baths
1,677
Sq Ft
$536/Sq Ft
Est. Value
About This Home
This home is located at 2007 W 149th St, Gardena, CA 90249 and is currently estimated at $898,604, approximately $535 per square foot. 2007 W 149th St is a home located in Los Angeles County with nearby schools including Chapman Elementary School, Robert E. Peary Middle School, and Gardena Senior High School.
Ownership History
Date
Name
Owned For
Owner Type
Purchase Details
Closed on
Aug 8, 2020
Sold by
Sebastian Virgil Espinosa and Sebastian Melissa Enriquez
Bought by
Sebastian Virgil Espinosa and Sebastian Melissa Enriquez
Current Estimated Value
Purchase Details
Closed on
Feb 2, 1998
Sold by
Kudo Kenichiro and Kudo Carolina
Bought by
Sebastian Virgil E and Sebastian Melissa E
Home Financials for this Owner
Home Financials are based on the most recent Mortgage that was taken out on this home.
Original Mortgage
$169,735
Outstanding Balance
$30,342
Interest Rate
7.11%
Mortgage Type
FHA
Estimated Equity
$868,262
Purchase Details
Closed on
Dec 11, 1995
Sold by
Lloyd Gary W and The Gary W Lloyd Trust
Bought by
Kudo Kenichiro and Kudo Carolina
Home Financials for this Owner
Home Financials are based on the most recent Mortgage that was taken out on this home.
Original Mortgage
$148,000
Interest Rate
7.36%
Create a Home Valuation Report for This Property
The Home Valuation Report is an in-depth analysis detailing your home's value as well as a comparison with similar homes in the area
Home Values in the Area
Average Home Value in this Area
Purchase History
| Date | Buyer | Sale Price | Title Company |
|---|---|---|---|
| Sebastian Virgil Espinosa | -- | None Available | |
| Sebastian Virgil E | $174,000 | Lawyers Title Company | |
| Kudo Kenichiro | $185,000 | Chicago Title |
Source: Public Records
Mortgage History
| Date | Status | Borrower | Loan Amount |
|---|---|---|---|
| Open | Sebastian Virgil E | $169,735 | |
| Previous Owner | Kudo Kenichiro | $148,000 |
Source: Public Records
Tax History
| Year | Tax Paid | Tax Assessment Tax Assessment Total Assessment is a certain percentage of the fair market value that is determined by local assessors to be the total taxable value of land and additions on the property. | Land | Improvement |
|---|---|---|---|---|
| 2025 | $3,847 | $277,807 | $170,840 | $106,967 |
| 2024 | $3,847 | $272,361 | $167,491 | $104,870 |
| 2023 | $3,780 | $267,021 | $164,207 | $102,814 |
| 2022 | $3,602 | $261,787 | $160,988 | $100,799 |
| 2021 | $3,556 | $256,655 | $157,832 | $98,823 |
| 2020 | $3,577 | $254,024 | $156,214 | $97,810 |
| 2019 | $3,445 | $249,044 | $153,151 | $95,893 |
| 2018 | $3,319 | $244,162 | $150,149 | $94,013 |
| 2016 | $3,159 | $234,682 | $144,319 | $90,363 |
| 2015 | $3,106 | $231,158 | $142,152 | $89,006 |
| 2014 | $3,114 | $226,631 | $139,368 | $87,263 |
Source: Public Records
Map
Nearby Homes
- 2116 Marine Ave
- 1824 Marine Ave
- 1830 W 145th St Unit C
- 2202 W 144th St
- 2032 W 154th St
- 14415 S Western Ave
- 1716 W 146th St Unit 2
- 14623 Roxton Ave
- 1652 W 146th St
- 14618 Dublin Ave
- 2174 Pearl Walk
- 15213 Arcturus Ave
- 15616 S Manhattan Place
- 2722 W 146th St
- 2112 W 157th St
- 2807 W 143rd Place
- 1506 W 152nd St
- 1450 W 146th St Unit 14
- 14012 S Wilkie Ave
- 15000 Halldale Ave Unit 101
- 2011 W 149th St
- 14805 Gramercy Place
- 1953 W 149th St
- 14903 Gramercy Place
- 14801 Gramercy Place
- 2015 W 149th St
- 1954 W 148th St
- 1949 W 149th St
- 2019 W 149th St
- 14911 Gramercy Place
- 1950 W 148th St
- 2014 W 149th St
- 1945 W 149th St
- 2018 W 149th St
- 2023 W 149th St
- 1946 W 148th St
- 14709 Gramercy Place
- 14915 Gramercy Place
- 1939 W 149th St
- 2022 W 149th St
Your Personal Tour Guide
Ask me questions while you tour the home.