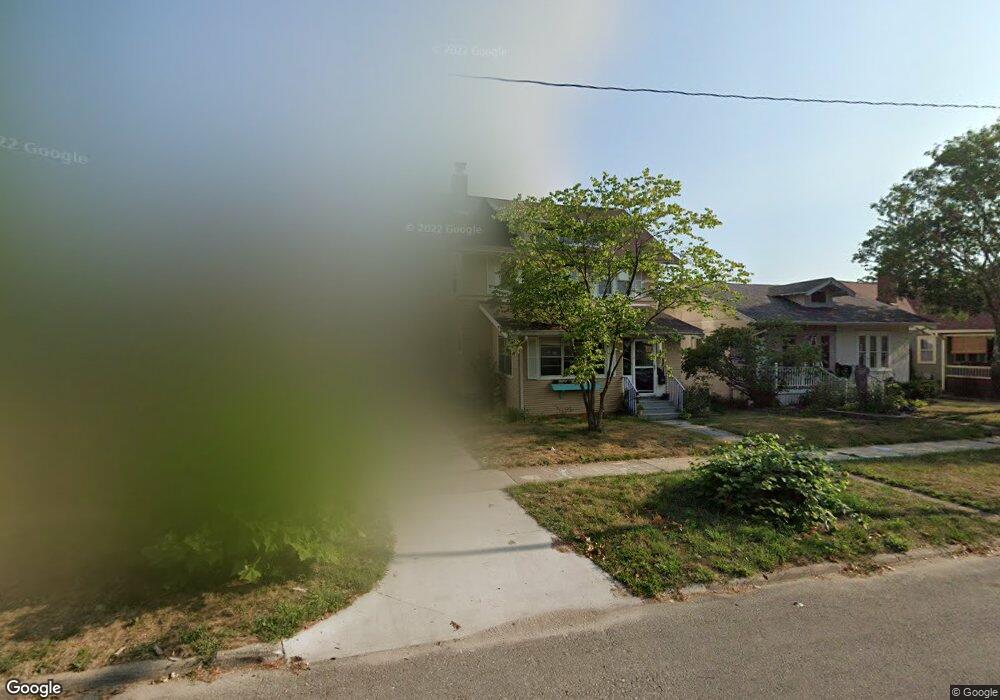
2008 Bever Ave SE Cedar Rapids, IA 52403
Bever Park NeighborhoodEstimated Value: $185,000 - $206,000
3
Beds
1
Bath
1,481
Sq Ft
$131/Sq Ft
Est. Value
About This Home
This home is located at 2008 Bever Ave SE, Cedar Rapids, IA 52403 and is currently estimated at $193,624, approximately $130 per square foot. 2008 Bever Ave SE is a home located in Linn County with nearby schools including Johnson STEAM Academy, McKinley STEAM Academy, and Boyd County High School.
Ownership History
Date
Name
Owned For
Owner Type
Purchase Details
Closed on
Jun 27, 2008
Sold by
Pfab Cory M and Pfab Jennifer E
Bought by
Leahy Sean P and Mccormally Gina E
Current Estimated Value
Home Financials for this Owner
Home Financials are based on the most recent Mortgage that was taken out on this home.
Original Mortgage
$55,500
Outstanding Balance
$35,768
Interest Rate
6.05%
Mortgage Type
Purchase Money Mortgage
Estimated Equity
$157,856
Purchase Details
Closed on
Aug 18, 2003
Sold by
Binger Paula and Gorman Paula
Bought by
Pfab Cory M and Pfab Jennifer E
Home Financials for this Owner
Home Financials are based on the most recent Mortgage that was taken out on this home.
Original Mortgage
$95,000
Interest Rate
5.62%
Mortgage Type
Unknown
Purchase Details
Closed on
Feb 22, 2000
Sold by
Scott Kathryn A
Bought by
Gorman Paula K
Home Financials for this Owner
Home Financials are based on the most recent Mortgage that was taken out on this home.
Original Mortgage
$83,700
Interest Rate
8.21%
Purchase Details
Closed on
Nov 5, 1997
Sold by
Sills Lawrence D and Sills Linda M
Bought by
Sills Lawrence D
Create a Home Valuation Report for This Property
The Home Valuation Report is an in-depth analysis detailing your home's value as well as a comparison with similar homes in the area
Home Values in the Area
Average Home Value in this Area
Purchase History
| Date | Buyer | Sale Price | Title Company |
|---|---|---|---|
| Leahy Sean P | $113,000 | None Available | |
| Pfab Cory M | $99,500 | -- | |
| Gorman Paula K | $92,500 | -- | |
| Sills Lawrence D | -- | -- |
Source: Public Records
Mortgage History
| Date | Status | Borrower | Loan Amount |
|---|---|---|---|
| Open | Leahy Sean P | $55,500 | |
| Previous Owner | Pfab Cory M | $95,000 | |
| Previous Owner | Gorman Paula K | $83,700 |
Source: Public Records
Tax History Compared to Growth
Tax History
| Year | Tax Paid | Tax Assessment Tax Assessment Total Assessment is a certain percentage of the fair market value that is determined by local assessors to be the total taxable value of land and additions on the property. | Land | Improvement |
|---|---|---|---|---|
| 2025 | $2,540 | $173,600 | $37,000 | $136,600 |
| 2024 | $2,894 | $158,800 | $34,000 | $124,800 |
| 2023 | $2,894 | $154,000 | $32,000 | $122,000 |
| 2022 | $2,616 | $146,100 | $32,000 | $114,100 |
| 2021 | $2,624 | $135,200 | $28,000 | $107,200 |
| 2020 | $2,624 | $127,500 | $24,000 | $103,500 |
| 2019 | $2,468 | $123,000 | $24,000 | $99,000 |
| 2018 | $2,396 | $123,000 | $24,000 | $99,000 |
| 2017 | $2,501 | $122,800 | $24,000 | $98,800 |
| 2016 | $2,501 | $117,700 | $24,000 | $93,700 |
| 2015 | $2,567 | $120,679 | $24,000 | $96,679 |
| 2014 | $2,382 | $123,102 | $20,000 | $103,102 |
| 2013 | $2,378 | $123,102 | $20,000 | $103,102 |
Source: Public Records
Map
Nearby Homes
- 371 20th St SE
- 1949 Park Ave SE
- 361 19th St SE
- 1815 Washington Ave SE
- 2020 Grande Ave SE
- 1816 Park Ave SE
- 414 18th St SE
- 1741 4th Ave SE
- 1815 5th Ave SE
- 510 Knollwood Dr SE
- 330 Crescent St SE
- 2144 Grande Ave SE
- 520 22nd St SE
- 1830 Grande Ave SE
- 2251 Bever Ave SE
- 1730 Park Ave SE
- 1727 Grande Ave SE
- 1929 Ridgeway Dr SE
- 1801 Blake Blvd SE
- 2323 Upland Dr SE
- 2012 Bever Ave SE
- 2004 Bever Ave SE
- 372 20th St SE
- 2018 Bever Ave SE
- 2000 Bever Ave SE
- 2022 Bever Ave SE
- 370 20th St SE
- 368 20th St SE
- 2026 Bever Ave SE
- 2015 Washington Ave SE
- 2017 Washington Ave SE
- 2005 Washington Ave SE
- 2023 Washington Ave SE
- 2030 Bever Ave SE
- 1956 Bever Ave SE
- 2009 Bever Ave SE
- 2015 Bever Ave SE
- 375 20th St SE
- 2027 Washington Ave SE
- 373 20th St SE