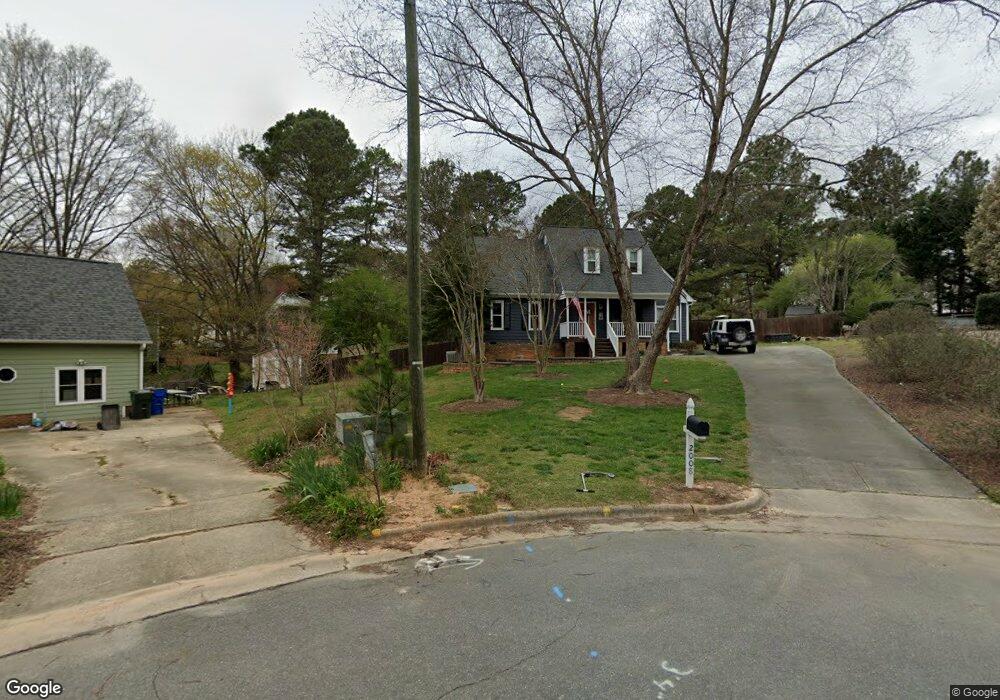
2008 Biddestone Ct Raleigh, NC 27612
North Hills NeighborhoodEstimated Value: $501,000 - $545,000
3
Beds
3
Baths
1,452
Sq Ft
$357/Sq Ft
Est. Value
About This Home
This home is located at 2008 Biddestone Ct, Raleigh, NC 27612 and is currently estimated at $517,652, approximately $356 per square foot. 2008 Biddestone Ct is a home located in Wake County with nearby schools including Lynn Road Elementary School, Carroll Middle, and Sanderson High School.
Ownership History
Date
Name
Owned For
Owner Type
Purchase Details
Closed on
Aug 12, 2015
Sold by
Daniel Marsha
Bought by
Mccarty Keith and Mccarty Rachel
Current Estimated Value
Home Financials for this Owner
Home Financials are based on the most recent Mortgage that was taken out on this home.
Original Mortgage
$249,986
Outstanding Balance
$197,013
Interest Rate
4.09%
Mortgage Type
VA
Estimated Equity
$320,639
Purchase Details
Closed on
Jun 27, 2012
Sold by
Poe Carl M
Bought by
Daniel Marsha
Home Financials for this Owner
Home Financials are based on the most recent Mortgage that was taken out on this home.
Original Mortgage
$178,000
Interest Rate
4.75%
Mortgage Type
New Conventional
Purchase Details
Closed on
Jun 12, 2001
Sold by
Fahey Sandra K and Umholtz George W
Bought by
Poe Carl M
Home Financials for this Owner
Home Financials are based on the most recent Mortgage that was taken out on this home.
Original Mortgage
$124,650
Interest Rate
7.17%
Create a Home Valuation Report for This Property
The Home Valuation Report is an in-depth analysis detailing your home's value as well as a comparison with similar homes in the area
Home Values in the Area
Average Home Value in this Area
Purchase History
| Date | Buyer | Sale Price | Title Company |
|---|---|---|---|
| Mccarty Keith | $245,000 | Attorney | |
| Daniel Marsha | $178,000 | None Available | |
| Poe Carl M | $141,000 | -- |
Source: Public Records
Mortgage History
| Date | Status | Borrower | Loan Amount |
|---|---|---|---|
| Open | Mccarty Keith | $249,986 | |
| Previous Owner | Daniel Marsha | $178,000 | |
| Previous Owner | Poe Carl M | $124,650 |
Source: Public Records
Tax History
| Year | Tax Paid | Tax Assessment Tax Assessment Total Assessment is a certain percentage of the fair market value that is determined by local assessors to be the total taxable value of land and additions on the property. | Land | Improvement |
|---|---|---|---|---|
| 2025 | $4,528 | $516,908 | $200,000 | $316,908 |
| 2024 | $4,509 | $516,908 | $200,000 | $316,908 |
Source: Public Records
Map
Nearby Homes
- 5613 Oldtowne Rd
- 5725 Pool Side Dr
- 5738 Three Oaks Dr
- 5444 Pine Top Cir
- 5529 Shadowbrook Dr
- 1541 Shadowood Ln
- 5400 Belsay Dr
- 5515 Lambshire Dr
- 5909 Lead Mine Rd
- 5607 Lambshire Dr
- 5108 Bridlington Ln
- 1900 Wimbish Ln
- 5405 N Hills Dr
- 1910 W Millbrook Rd
- 1375 Garden Crest Cir
- 1904 French Dr
- 1306 Lennox Place
- 1713 Frenchwood Dr
- 1104 Temple St
- 1112 Whippoorwill Ln
- 2004 Biddestone Ct
- 2009 Biddestone Ct
- 5620 Groomsbridge Ct
- 5616 Groomsbridge Ct
- 2000 Biddestone Ct
- 2005 Biddestone Ct
- 5612 Groomsbridge Ct
- 5624 Groomsbridge Ct
- 2001 Biddestone Ct
- 5608 Groomsbridge Ct
- 5625 Groomsbridge Ct
- 5613 Old Towne Rd
- 5758 Three Oaks Dr
- 5621 Groomsbridge Ct
- 5756 3 Oaks Dr
- 5756 Three Oaks Dr
- 5754 Three Oaks Dr
- 5609 Oldtowne Rd
- 5757 Three Oaks Dr
- 5760 Three Oaks Dr
Your Personal Tour Guide
Ask me questions while you tour the home.