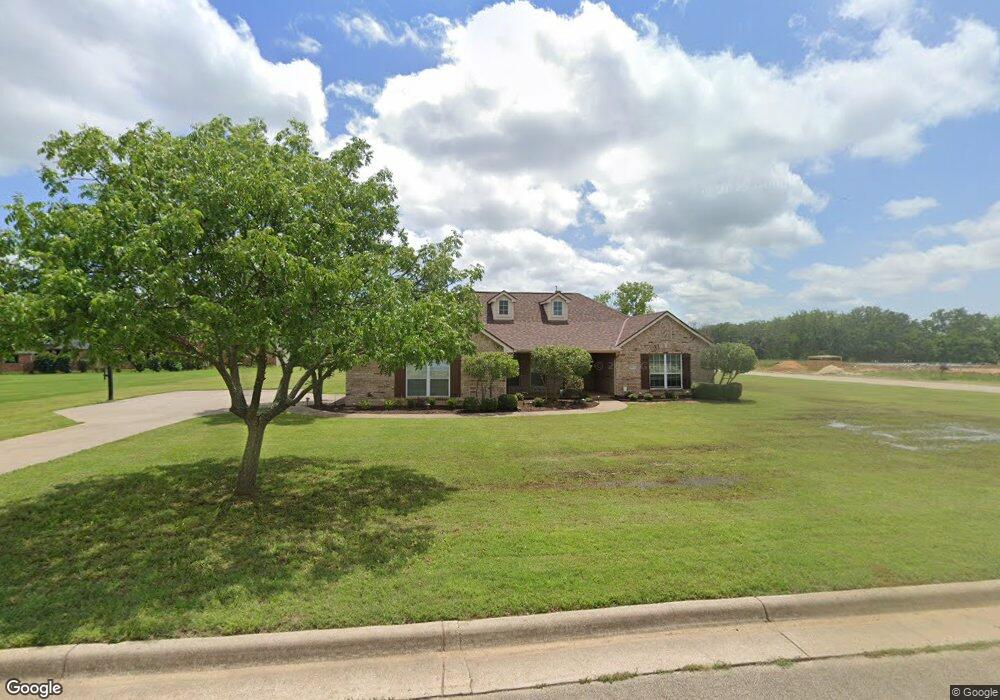
2008 Big Springs Dr Joshua, TX 76058
Estimated Value: $363,136 - $440,000
3
Beds
2
Baths
1,731
Sq Ft
$234/Sq Ft
Est. Value
About This Home
This home is located at 2008 Big Springs Dr, Joshua, TX 76058 and is currently estimated at $405,784, approximately $234 per square foot. 2008 Big Springs Dr is a home located in Johnson County with nearby schools including Plum Creek Elementary School, Joshua High School, and Joshua High School - 9th Grade Campus.
Ownership History
Date
Name
Owned For
Owner Type
Purchase Details
Closed on
Mar 24, 2014
Sold by
Schmaltz Lance K and Schmaltz Kelly A
Bought by
Neill Dennis W O
Current Estimated Value
Home Financials for this Owner
Home Financials are based on the most recent Mortgage that was taken out on this home.
Original Mortgage
$4,012,044
Outstanding Balance
$3,045,599
Interest Rate
4.38%
Mortgage Type
New Conventional
Estimated Equity
-$2,639,815
Purchase Details
Closed on
Dec 22, 2004
Sold by
Parker Bc Development Ltd
Bought by
Schmaltz Lance K and Schmaltz Kelly A
Home Financials for this Owner
Home Financials are based on the most recent Mortgage that was taken out on this home.
Original Mortgage
$158,000
Interest Rate
5.76%
Mortgage Type
New Conventional
Create a Home Valuation Report for This Property
The Home Valuation Report is an in-depth analysis detailing your home's value as well as a comparison with similar homes in the area
Home Values in the Area
Average Home Value in this Area
Purchase History
| Date | Buyer | Sale Price | Title Company |
|---|---|---|---|
| Neill Dennis W O | -- | None Available | |
| Schmaltz Lance K | -- | Atc |
Source: Public Records
Mortgage History
| Date | Status | Borrower | Loan Amount |
|---|---|---|---|
| Open | Neill Dennis W O | $4,012,044 | |
| Previous Owner | Schmaltz Lance K | $158,000 |
Source: Public Records
Tax History Compared to Growth
Tax History
| Year | Tax Paid | Tax Assessment Tax Assessment Total Assessment is a certain percentage of the fair market value that is determined by local assessors to be the total taxable value of land and additions on the property. | Land | Improvement |
|---|---|---|---|---|
| 2025 | $8,190 | $317,141 | $36,000 | $281,141 |
| 2024 | $8,190 | $336,534 | $36,000 | $300,534 |
| 2023 | $6,868 | $308,577 | $36,000 | $272,577 |
| 2022 | $7,041 | $280,621 | $36,000 | $244,621 |
| 2021 | $6,219 | $245,676 | $36,000 | $209,676 |
| 2020 | $5,769 | $210,729 | $36,000 | $174,729 |
| 2019 | $6,062 | $210,729 | $36,000 | $174,729 |
| 2018 | $6,231 | $210,729 | $36,000 | $174,729 |
| 2017 | $5,814 | $196,751 | $36,000 | $160,751 |
| 2016 | $4,507 | $152,515 | $36,000 | $116,515 |
| 2015 | $3,876 | $152,515 | $36,000 | $116,515 |
| 2014 | $3,876 | $152,515 | $36,000 | $116,515 |
Source: Public Records
Map
Nearby Homes
- 3004 Valley View Dr
- 3012 Valley View Dr
- 6013 Valley View Dr
- Scottsdale II Plan at Joshua Meadows
- Lexington SE Plan at Joshua Meadows
- Nottingham I Plan at Joshua Meadows
- Fairview SE Plan at Joshua Meadows
- Wildwood SE Plan at Joshua Meadows
- Henderson Plan at Joshua Meadows
- Kingswood Plan at Joshua Meadows
- Nottingham II Plan at Joshua Meadows
- Scottsdale I Plan at Joshua Meadows
- Bellaire SE Plan at Joshua Meadows
- Westwood SE Plan at Joshua Meadows
- El Dorado Plan at Joshua Meadows
- Ashwood Plan at Joshua Meadows
- 4012 Twin Hills Ct
- 2009 Running Brook Dr
- 2021 Running Brook Dr
- 6020 Glenwood Dr
- 2012 Big Springs Dr
- 4004 Crestwood Dr
- 3000 Valley View Dr
- 2013 Big Springs Dr
- 2009 Big Springs Dr
- 2001 Big Springs Dr
- 4008 Crestwood Dr
- 4001 Crestwood Dr
- 2005 Big Springs Dr
- 3004 Glenwood Dr
- 2017 Big Springs Dr
- 4012 Crestwood Dr
- 4003 Crestwood Dr
- 3000 Glenwood Dr
- 1006 Glenwood Dr
- 2000 Glenwood Dr
- 4009 Crestwood Dr
- 4000 Glenwood Dr
- 4008 Glenwood Dr
- 3001 Big Springs Dr