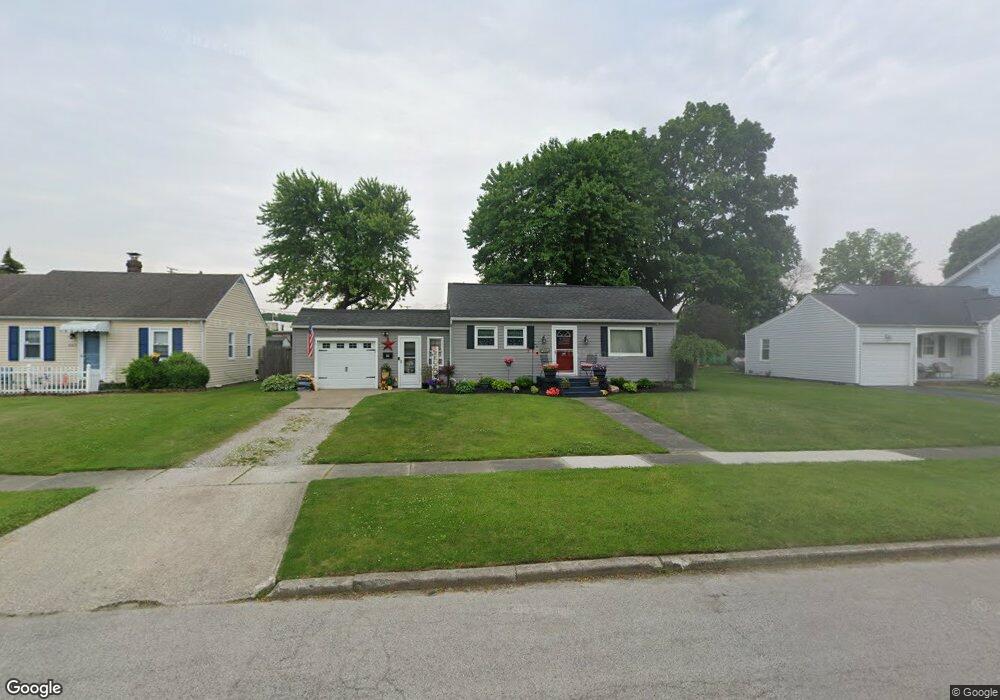
2008 E 45th St Ashtabula, OH 44004
Estimated Value: $116,923 - $155,000
2
Beds
1
Bath
768
Sq Ft
$187/Sq Ft
Est. Value
About This Home
This home is located at 2008 E 45th St, Ashtabula, OH 44004 and is currently estimated at $143,981, approximately $187 per square foot. 2008 E 45th St is a home located in Ashtabula County with nearby schools including Lakeside High School and Christian Faith Academy.
Ownership History
Date
Name
Owned For
Owner Type
Purchase Details
Closed on
Nov 1, 2005
Sold by
Houston Dawn N
Bought by
Berkowitz Dawn N and Berkowitz Mark
Current Estimated Value
Home Financials for this Owner
Home Financials are based on the most recent Mortgage that was taken out on this home.
Original Mortgage
$65,250
Outstanding Balance
$36,035
Interest Rate
6.17%
Mortgage Type
Fannie Mae Freddie Mac
Estimated Equity
$107,946
Purchase Details
Closed on
Jul 11, 1996
Sold by
Skaggs Martin K
Bought by
Houston Dawn N
Home Financials for this Owner
Home Financials are based on the most recent Mortgage that was taken out on this home.
Original Mortgage
$45,000
Interest Rate
8.09%
Mortgage Type
New Conventional
Create a Home Valuation Report for This Property
The Home Valuation Report is an in-depth analysis detailing your home's value as well as a comparison with similar homes in the area
Home Values in the Area
Average Home Value in this Area
Purchase History
| Date | Buyer | Sale Price | Title Company |
|---|---|---|---|
| Berkowitz Dawn N | -- | Richmond Title Services Lp | |
| Houston Dawn N | $52,900 | -- |
Source: Public Records
Mortgage History
| Date | Status | Borrower | Loan Amount |
|---|---|---|---|
| Open | Berkowitz Dawn N | $65,250 | |
| Previous Owner | Houston Dawn N | $45,000 |
Source: Public Records
Tax History
| Year | Tax Paid | Tax Assessment Tax Assessment Total Assessment is a certain percentage of the fair market value that is determined by local assessors to be the total taxable value of land and additions on the property. | Land | Improvement |
|---|---|---|---|---|
| 2024 | $2,529 | $29,440 | $6,900 | $22,540 |
| 2023 | $1,465 | $29,440 | $6,900 | $22,540 |
| 2022 | $1,215 | $21,420 | $5,320 | $16,100 |
| 2021 | $1,225 | $21,420 | $5,320 | $16,100 |
| 2020 | $1,244 | $21,420 | $5,320 | $16,100 |
| 2019 | $1,027 | $16,660 | $5,600 | $11,060 |
| 2018 | $930 | $16,660 | $5,600 | $11,060 |
| 2017 | $889 | $16,660 | $5,600 | $11,060 |
| 2016 | $873 | $14,980 | $5,040 | $9,940 |
| 2015 | $849 | $14,980 | $5,040 | $9,940 |
| 2014 | $826 | $14,980 | $5,040 | $9,940 |
| 2013 | $1,009 | $19,820 | $2,770 | $17,050 |
Source: Public Records
Map
Nearby Homes
- 4422 State Rd
- 4422 Rodgers Rd
- 2130 E 44th St
- 4320 Birchwood Ave
- 1629 E 47th St
- 4016 State Rd
- 2124 E 40th St
- 1930 E 52nd St
- 183 1626 E 51st St
- 1626 #165 E 51st St
- 1626 132 E 51st St
- 5031 Blakeslee Ave
- 4211 Park Ave
- 2930 S Ridge Rd E
- 3603 Silvieus Dr
- 137 Grove Dr
- 3129 Lincoln Dr
- 3835 Lake Ave
- 3024 Latimer Ave
- 3829 Lake Ave
Your Personal Tour Guide
Ask me questions while you tour the home.