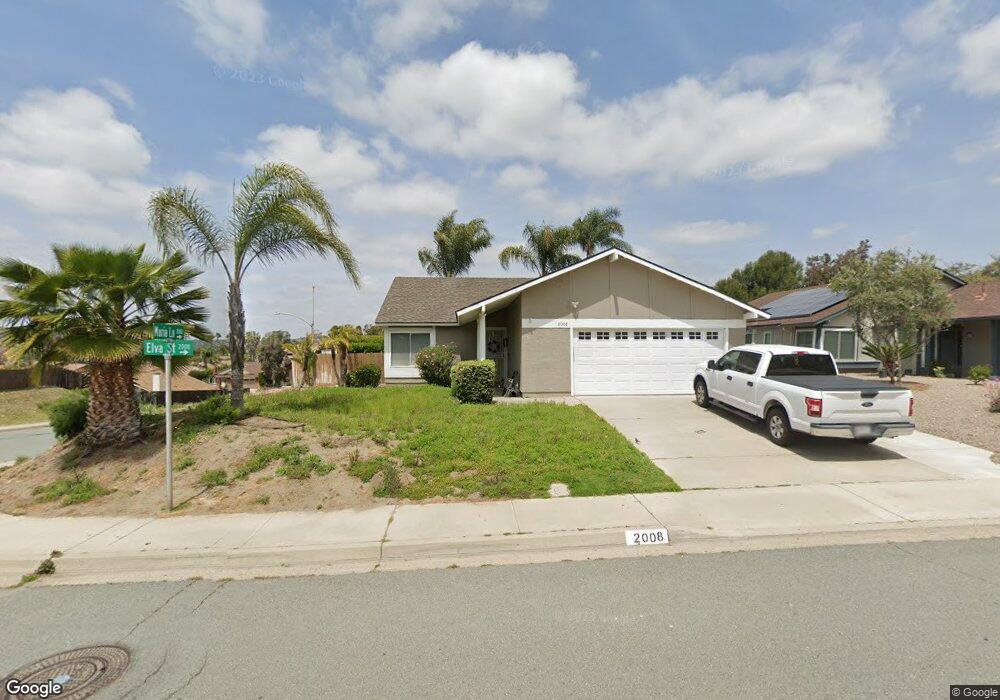
2008 Elva St El Cajon, CA 92019
Rancho Park NeighborhoodEstimated Value: $860,743 - $968,000
3
Beds
2
Baths
1,251
Sq Ft
$731/Sq Ft
Est. Value
About This Home
This home is located at 2008 Elva St, El Cajon, CA 92019 and is currently estimated at $914,686, approximately $731 per square foot. 2008 Elva St is a home located in San Diego County with nearby schools including Vista Grande Elementary, Hillsdale Middle School, and Valhalla High.
Ownership History
Date
Name
Owned For
Owner Type
Purchase Details
Closed on
Dec 28, 2017
Sold by
Arvidson Donald W and Arvidson Carol Y
Bought by
Slade Matthew L and Rafi Sarah
Current Estimated Value
Home Financials for this Owner
Home Financials are based on the most recent Mortgage that was taken out on this home.
Original Mortgage
$542,000
Outstanding Balance
$457,384
Interest Rate
3.94%
Mortgage Type
VA
Estimated Equity
$457,302
Purchase Details
Closed on
May 3, 2002
Sold by
Gehman James L and Gehman Lori L
Bought by
Arvidson Donald W and Arvidson Carol Y
Home Financials for this Owner
Home Financials are based on the most recent Mortgage that was taken out on this home.
Original Mortgage
$249,000
Interest Rate
6.83%
Purchase Details
Closed on
Mar 16, 1993
Purchase Details
Closed on
Dec 30, 1983
Create a Home Valuation Report for This Property
The Home Valuation Report is an in-depth analysis detailing your home's value as well as a comparison with similar homes in the area
Home Values in the Area
Average Home Value in this Area
Purchase History
| Date | Buyer | Sale Price | Title Company |
|---|---|---|---|
| Slade Matthew L | $542,000 | Fidelity National Title | |
| Arvidson Donald W | $325,000 | First American Title Co | |
| -- | $159,000 | -- | |
| -- | $97,000 | -- |
Source: Public Records
Mortgage History
| Date | Status | Borrower | Loan Amount |
|---|---|---|---|
| Open | Slade Matthew L | $542,000 | |
| Previous Owner | Arvidson Donald W | $249,000 |
Source: Public Records
Tax History
| Year | Tax Paid | Tax Assessment Tax Assessment Total Assessment is a certain percentage of the fair market value that is determined by local assessors to be the total taxable value of land and additions on the property. | Land | Improvement |
|---|---|---|---|---|
| 2025 | $5,477 | $616,697 | $284,629 | $332,068 |
| 2024 | $5,477 | $604,606 | $279,049 | $325,557 |
| 2023 | $5,399 | $592,752 | $273,578 | $319,174 |
| 2022 | $5,405 | $581,130 | $268,214 | $312,916 |
| 2021 | $5,327 | $569,736 | $262,955 | $306,781 |
| 2020 | $5,263 | $563,895 | $260,259 | $303,636 |
| 2019 | $5,213 | $552,839 | $255,156 | $297,683 |
| 2018 | $5,248 | $421,955 | $194,748 | $227,207 |
| 2017 | $5,180 | $413,682 | $190,930 | $222,752 |
| 2016 | $4,977 | $405,572 | $187,187 | $218,385 |
| 2015 | $4,944 | $399,481 | $184,376 | $215,105 |
| 2014 | $4,849 | $391,657 | $180,765 | $210,892 |
Source: Public Records
Map
Nearby Homes
- 2026 Capri Ct
- 2552 Wind River Rd
- 1818 Sonett St
- 2075 Pierce Ct
- 2049 Wind River Rd
- 2846 Willow Glen Dr
- 1810 Hillsdale Rd Unit 94
- 2011 Monarch Ridge Cir
- 1975 Julianna St
- 1912 Jalisco Rd
- 2450 Sawgrass St
- 12092 Calle de Leon Unit 45
- 12083 Calle de Montana Unit 219
- 0 Hillsdale Rd Unit PTP2601192
- 12046 Calle de Montana Unit 274
- 1525 Fair Glen Rd
- 1423 Vista Grande Rd
- 11992 Avenida Marcella
- 11438 Via Rancho San Diego Unit 141
- 1426 Hidden Mesa View Dr
Your Personal Tour Guide
Ask me questions while you tour the home.