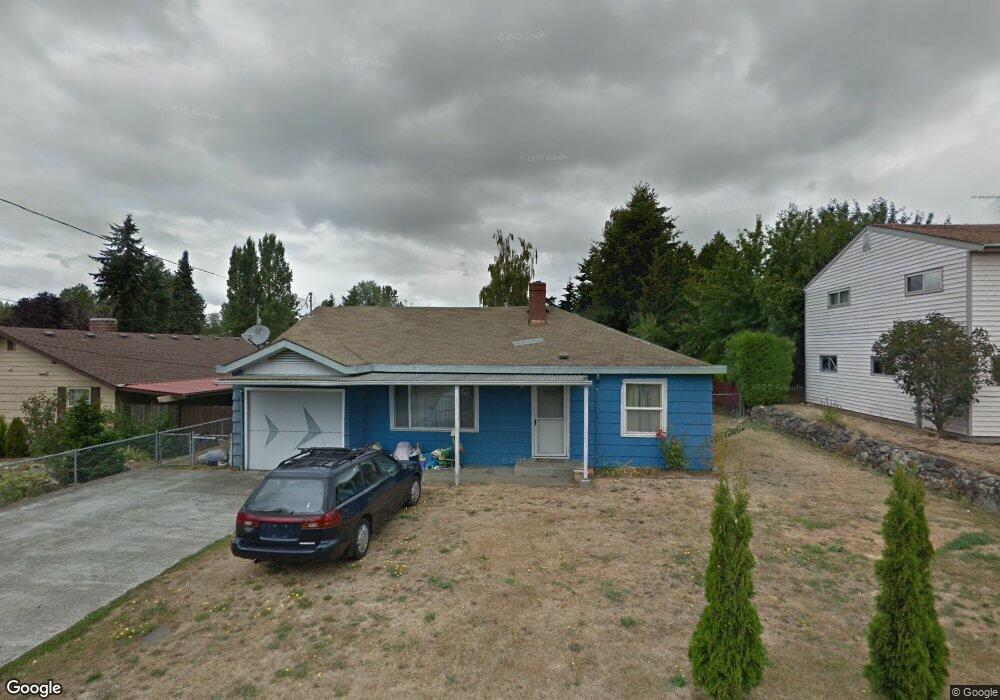
2008 S 126th St Seattle, WA 98168
Boulevard Park NeighborhoodEstimated Value: $473,789 - $535,000
2
Beds
1
Bath
990
Sq Ft
$504/Sq Ft
Est. Value
About This Home
This home is located at 2008 S 126th St, Seattle, WA 98168 and is currently estimated at $499,197, approximately $504 per square foot. 2008 S 126th St is a home located in King County with nearby schools including Hilltop Elementary School, Glacier Middle School, and Highline High School.
Ownership History
Date
Name
Owned For
Owner Type
Purchase Details
Closed on
Jun 24, 2009
Sold by
Bank Of America National Association
Bought by
Prasad Dharmendra and Prasad Sanjela
Current Estimated Value
Home Financials for this Owner
Home Financials are based on the most recent Mortgage that was taken out on this home.
Original Mortgage
$159,490
Outstanding Balance
$101,310
Interest Rate
4.87%
Estimated Equity
$397,887
Purchase Details
Closed on
Jan 6, 2009
Sold by
Spicer Rosemarie
Bought by
Bank Of America National Association
Purchase Details
Closed on
Mar 13, 2006
Sold by
Gilbert Alvin N and Gilbert Diane E
Bought by
Spicer Rosemarie
Home Financials for this Owner
Home Financials are based on the most recent Mortgage that was taken out on this home.
Original Mortgage
$183,200
Interest Rate
7.8%
Purchase Details
Closed on
Sep 14, 1998
Sold by
Morris Allen O and Morris Lynne M
Bought by
Gilbert Alvin N and Gilbert Diane E
Create a Home Valuation Report for This Property
The Home Valuation Report is an in-depth analysis detailing your home's value as well as a comparison with similar homes in the area
Home Values in the Area
Average Home Value in this Area
Purchase History
| Date | Buyer | Sale Price | Title Company |
|---|---|---|---|
| Prasad Dharmendra | $159,997 | Chicago Title Insurance C | |
| Bank Of America National Association | $216,189 | Fidelity Natio | |
| Spicer Rosemarie | $229,000 | Transnation Ti | |
| Spicer Rosemarie | -- | Transnation Ti | |
| Gilbert Alvin N | $104,000 | -- |
Source: Public Records
Mortgage History
| Date | Status | Borrower | Loan Amount |
|---|---|---|---|
| Open | Prasad Dharmendra | $159,490 | |
| Previous Owner | Spicer Rosemarie | $183,200 |
Source: Public Records
Tax History Compared to Growth
Tax History
| Year | Tax Paid | Tax Assessment Tax Assessment Total Assessment is a certain percentage of the fair market value that is determined by local assessors to be the total taxable value of land and additions on the property. | Land | Improvement |
|---|---|---|---|---|
| 2024 | $4,611 | $410,000 | $180,000 | $230,000 |
| 2023 | $4,293 | $359,000 | $144,000 | $215,000 |
| 2022 | $4,173 | $389,000 | $126,000 | $263,000 |
| 2021 | $3,805 | $335,000 | $110,000 | $225,000 |
| 2020 | $3,732 | $294,000 | $97,000 | $197,000 |
| 2018 | $3,088 | $269,000 | $120,000 | $149,000 |
| 2017 | $2,630 | $216,000 | $101,000 | $115,000 |
| 2016 | $2,199 | $185,000 | $86,000 | $99,000 |
| 2015 | $2,189 | $158,000 | $75,000 | $83,000 |
| 2014 | -- | $152,000 | $72,000 | $80,000 |
| 2013 | -- | $130,000 | $66,000 | $64,000 |
Source: Public Records
Map
Nearby Homes
- 12246 20th Ave S
- 12644 Des Moines Memorial Dr S
- 12225 Roseberg Ave S Unit 4
- 12225 Roseberg Ave S Unit 5
- 12225 Roseberg Ave S Unit 3
- 12225 Roseberg Ave S Unit 7
- 12225 Roseberg Ave S Unit 9
- 12225 Roseberg Ave S Unit 8
- 12201 Des Moines Memorial Dr S Unit B
- 12629 16th Ave S
- 2414 S 121st Place
- 0 Lot 4 S 125th Place
- 2604 S 122nd St
- 12042 26th Ave S
- 11807 Military Rd S
- 12428 12th Ave S
- 13307 24th Ave S
- 1808 S 118th St Unit 102
- 2704 S 120th Place
- 13422 22nd Ave S
- 2016 S 126th St
- 12450 20th Ave S
- 12444 20th Ave S
- 12443 21st Ave S
- 2026 S 126th St
- 12436 20th Ave S
- 12604 20th Ave S
- 2007 S 126th St
- 12437 21st Ave S
- 2033 S 126th St
- 12432 20th Ave S
- 12449 20th Ave S
- 12441 20th Ave S
- 12455 20th Ave S
- 12431 21st Ave S
- 12612 20th Ave S
- 12461 20th Ave S
- 2106 S 126th St
- 12619 21st Ave S
- 12424 20th Ave S