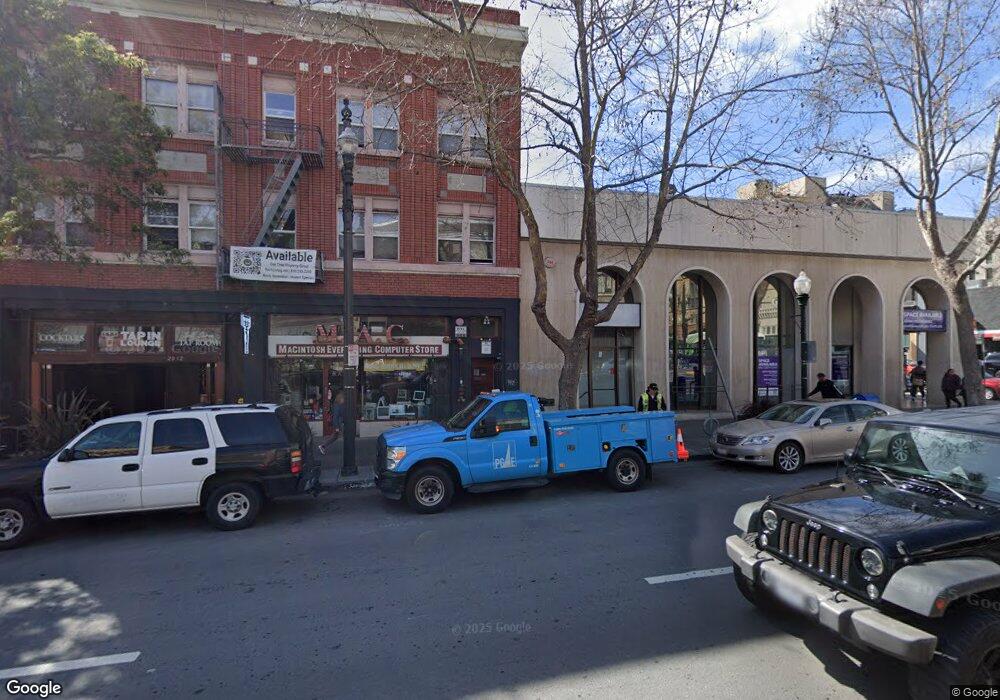
2008 Shattuck Ave Berkeley, CA 94704
Downtown Berkeley NeighborhoodEstimated Value: $8,090,329
Studio
--
Bath
13,194
Sq Ft
$613/Sq Ft
Est. Value
About This Home
This home is located at 2008 Shattuck Ave, Berkeley, CA 94704 and is currently estimated at $8,090,329, approximately $613 per square foot. 2008 Shattuck Ave is a home located in Alameda County with nearby schools including Berkeley Arts Magnet at Whittier School, Washington Elementary School, and Oxford Elementary School.
Ownership History
Date
Name
Owned For
Owner Type
Purchase Details
Closed on
May 10, 2016
Sold by
2008 Shattuck Ave Llc
Bought by
2008 Shattuck Ave Llc
Current Estimated Value
Home Financials for this Owner
Home Financials are based on the most recent Mortgage that was taken out on this home.
Original Mortgage
$3,200,000
Outstanding Balance
$2,528,163
Interest Rate
3.43%
Mortgage Type
Commercial
Estimated Equity
$5,819,490
Purchase Details
Closed on
Aug 20, 2015
Sold by
Ho Ming Hang and Ho Albert M
Bought by
2008 Shattuck Avenue Llc
Purchase Details
Closed on
Jul 9, 2015
Sold by
Lee Boy Yi
Bought by
Ho Ming Hang
Purchase Details
Closed on
Mar 10, 2010
Sold by
Ho Albert M
Bought by
Ho Albert M and Ho Serena
Purchase Details
Closed on
Nov 18, 1998
Sold by
Meng Hsueh H
Bought by
Ho Meng Hsueh and Ho Shin Jung
Purchase Details
Closed on
Nov 22, 1994
Sold by
Bachenheimer Lauri and Aguilar Alaiya
Bought by
Ho Ming Hang and Ho Albert M
Create a Home Valuation Report for This Property
The Home Valuation Report is an in-depth analysis detailing your home's value as well as a comparison with similar homes in the area
Home Values in the Area
Average Home Value in this Area
Purchase History
| Date | Buyer | Sale Price | Title Company |
|---|---|---|---|
| 2008 Shattuck Ave Llc | -- | Old Republic Title Company | |
| 2008 Shattuck Avenue Llc | $5,175,000 | Old Republic Title Company | |
| Ho Ming Hang | -- | Old Republic Title Company | |
| Ho Albert M | -- | None Available | |
| Ho Meng Hsueh | -- | -- | |
| Ho Ming Hang | $1,060,000 | Chicago Title Company |
Source: Public Records
Mortgage History
| Date | Status | Borrower | Loan Amount |
|---|---|---|---|
| Open | 2008 Shattuck Ave Llc | $3,200,000 |
Source: Public Records
Tax History Compared to Growth
Tax History
| Year | Tax Paid | Tax Assessment Tax Assessment Total Assessment is a certain percentage of the fair market value that is determined by local assessors to be the total taxable value of land and additions on the property. | Land | Improvement |
|---|---|---|---|---|
| 2025 | $101,499 | $6,126,009 | $1,556,657 | $4,569,352 |
| 2024 | $101,499 | $6,005,897 | $1,526,136 | $4,479,761 |
| 2023 | $99,277 | $5,888,166 | $1,496,220 | $4,391,946 |
| 2022 | $97,417 | $5,772,712 | $1,466,882 | $4,305,830 |
| 2021 | $97,420 | $5,659,534 | $1,438,123 | $4,221,411 |
| 2020 | $92,131 | $5,601,523 | $1,423,382 | $4,178,141 |
| 2019 | $89,055 | $5,491,710 | $1,395,478 | $4,096,232 |
| 2018 | $87,600 | $5,384,070 | $1,368,126 | $4,015,944 |
| 2017 | $84,752 | $5,278,500 | $1,341,300 | $3,937,200 |
| 2016 | $84,003 | $5,175,000 | $1,315,000 | $3,860,000 |
| 2015 | $38,291 | $1,481,412 | $366,160 | $1,115,252 |
| 2014 | $37,601 | $1,452,400 | $358,989 | $1,093,411 |
Source: Public Records
Map
Nearby Homes
- 2117 Delaware St Unit B
- 1682 Oxford St
- 2201 Virginia St Unit 2
- 2218 -2222 Grant St
- 1609 Bonita Ave Unit 3
- 1609 Bonita Ave Unit 5
- 2340 Virginia St
- 2201 McGee Ave
- 1521 Josephine St
- 2451 Le Conte Ave
- 1929 California St
- 1444 Walnut St
- 2477 Virginia St
- 2118 California St
- 2201 Spaulding Ave
- 2634 Virginia St Unit 13
- 2316 Blake St Unit D
- 2537 Ellsworth St
- 1901 Parker St Unit 3
- 2700 Le Conte Ave Unit 301
- 2024 Shattuck Ave
- 64 Shattuck Square
- 61 Shattuck Square
- 91 Shattuck Square
- 82 Shattuck Square
- 2067 University Ave
- 2057 University Ave
- 2059 University Ave
- 2072 Addison St
- 123 Berkeley Square
- 1974 Shattuck Ave
- 2025 Kala Bagai Way Unit 201
- 2025 Kala Bagai Way
- 2023 Shattuck Ave
- 2017 Shattuck Ave
- 2114 Shattuck Ave
- 2037 Shattuck Ave
- 1950 Shattuck Ave
- 1956 Shattuck Ave
- 2018-2030 University Ave