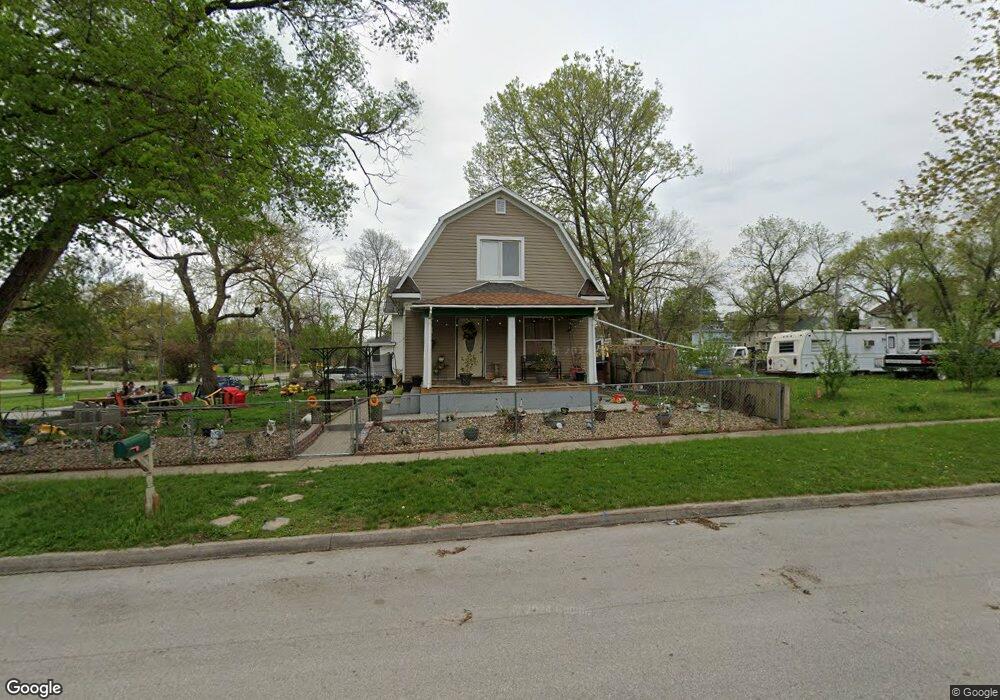
2009 9th St Des Moines, IA 50314
River Bend NeighborhoodEstimated Value: $112,000 - $139,000
3
Beds
1
Bath
1,065
Sq Ft
$114/Sq Ft
Est. Value
About This Home
This home is located at 2009 9th St, Des Moines, IA 50314 and is currently estimated at $121,651, approximately $114 per square foot. 2009 9th St is a home located in Polk County with nearby schools including Moulton Elementary School, Harding Middle School, and North High School.
Ownership History
Date
Name
Owned For
Owner Type
Purchase Details
Closed on
Jun 14, 2001
Sold by
Banning Jo Ann
Bought by
Miranda Cristobal and Miranda Olga
Current Estimated Value
Home Financials for this Owner
Home Financials are based on the most recent Mortgage that was taken out on this home.
Original Mortgage
$43,300
Interest Rate
6.7%
Purchase Details
Closed on
Nov 24, 1997
Sold by
Banning Arlan L and Banning Joann
Bought by
Miranda Cristobal and Miranda Olga
Create a Home Valuation Report for This Property
The Home Valuation Report is an in-depth analysis detailing your home's value as well as a comparison with similar homes in the area
Home Values in the Area
Average Home Value in this Area
Purchase History
| Date | Buyer | Sale Price | Title Company |
|---|---|---|---|
| Miranda Cristobal | $42,000 | -- | |
| Miranda Cristobal | $47,000 | -- |
Source: Public Records
Mortgage History
| Date | Status | Borrower | Loan Amount |
|---|---|---|---|
| Closed | Miranda Cristobal | $43,300 |
Source: Public Records
Tax History
| Year | Tax Paid | Tax Assessment Tax Assessment Total Assessment is a certain percentage of the fair market value that is determined by local assessors to be the total taxable value of land and additions on the property. | Land | Improvement |
|---|---|---|---|---|
| 2025 | $1,512 | $100,700 | $8,800 | $91,900 |
| 2024 | $1,512 | $87,300 | $7,600 | $79,700 |
| 2023 | $1,446 | $87,300 | $7,600 | $79,700 |
| 2022 | $1,432 | $70,200 | $6,300 | $63,900 |
| 2021 | $1,318 | $70,200 | $6,300 | $63,900 |
| 2020 | $1,364 | $61,400 | $5,600 | $55,800 |
| 2019 | $1,268 | $61,400 | $5,600 | $55,800 |
| 2018 | $1,250 | $55,700 | $5,000 | $50,700 |
| 2017 | $1,194 | $55,700 | $5,000 | $50,700 |
| 2016 | $1,158 | $52,700 | $4,700 | $48,000 |
| 2015 | $1,158 | $52,700 | $4,700 | $48,000 |
| 2014 | $1,054 | $50,100 | $4,500 | $45,600 |
Source: Public Records
Map
Nearby Homes
Your Personal Tour Guide
Ask me questions while you tour the home.