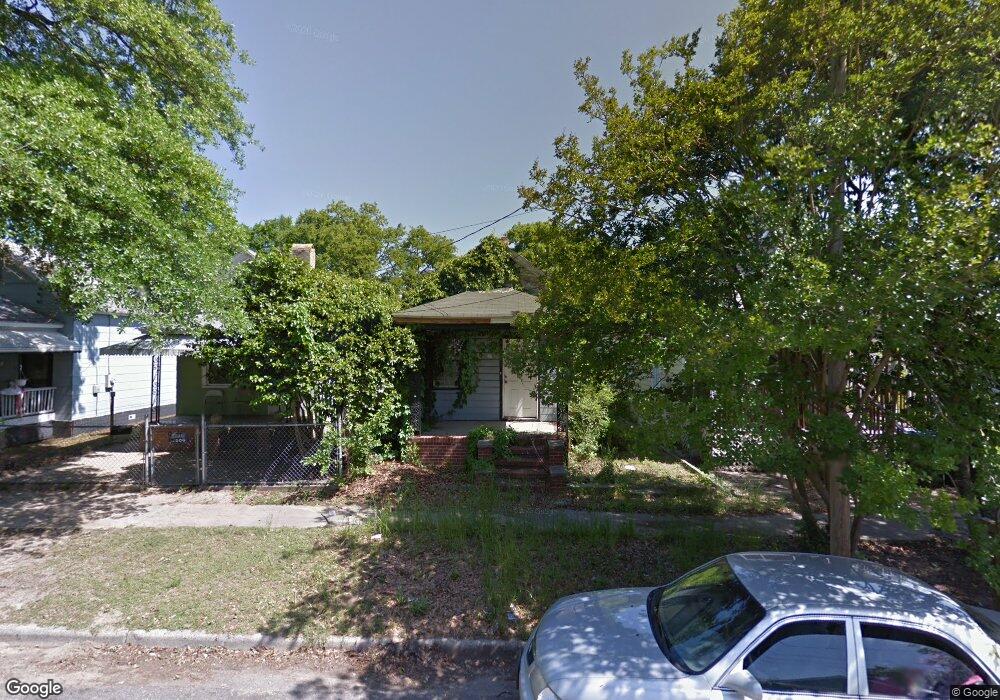
2009 Clark St Augusta, GA 30904
West End NeighborhoodEstimated Value: $57,255 - $85,000
2
Beds
1
Bath
748
Sq Ft
$88/Sq Ft
Est. Value
About This Home
This home is located at 2009 Clark St, Augusta, GA 30904 and is currently estimated at $65,814, approximately $87 per square foot. 2009 Clark St is a home located in Richmond County with nearby schools including Lamar Elementary School, W.S. Hornsby Elementary School, and Johnson Magnet.
Ownership History
Date
Name
Owned For
Owner Type
Purchase Details
Closed on
May 22, 2023
Sold by
Plemmons Michael Earl
Bought by
Felz Anna Rachel
Current Estimated Value
Home Financials for this Owner
Home Financials are based on the most recent Mortgage that was taken out on this home.
Original Mortgage
$18,000
Outstanding Balance
$9,416
Interest Rate
6.39%
Mortgage Type
Mortgage Modification
Estimated Equity
$56,398
Purchase Details
Closed on
Feb 18, 2013
Sold by
Oellerich James Douglas
Bought by
Plemmons Michael
Purchase Details
Closed on
Oct 3, 2006
Sold by
Maddox Gena
Bought by
Oellerich James Douglas
Purchase Details
Closed on
May 30, 2001
Sold by
Oellerich James Douglas
Bought by
Maddox Gena
Home Financials for this Owner
Home Financials are based on the most recent Mortgage that was taken out on this home.
Original Mortgage
$20,000
Interest Rate
7.05%
Mortgage Type
Seller Take Back
Purchase Details
Closed on
Dec 28, 1992
Sold by
Oellerich James E J
Bought by
Oellerich James Dou
Purchase Details
Closed on
Dec 1, 1992
Sold by
Oellerich James Edw
Bought by
Oellerich Jo Anne
Create a Home Valuation Report for This Property
The Home Valuation Report is an in-depth analysis detailing your home's value as well as a comparison with similar homes in the area
Home Values in the Area
Average Home Value in this Area
Purchase History
| Date | Buyer | Sale Price | Title Company |
|---|---|---|---|
| Felz Anna Rachel | $16,000 | -- | |
| Plemmons Michael | $2,000 | -- | |
| Oellerich James Douglas | $17,600 | None Available | |
| Oellerich James Douglas | -- | -- | |
| Maddox Gena | $20,000 | -- | |
| Oellerich James Dou | -- | -- | |
| Oellerich Jo Anne | -- | -- |
Source: Public Records
Mortgage History
| Date | Status | Borrower | Loan Amount |
|---|---|---|---|
| Open | Felz Anna Rachel | $18,000 | |
| Previous Owner | Maddox Gena | $20,000 |
Source: Public Records
Tax History
| Year | Tax Paid | Tax Assessment Tax Assessment Total Assessment is a certain percentage of the fair market value that is determined by local assessors to be the total taxable value of land and additions on the property. | Land | Improvement |
|---|---|---|---|---|
| 2025 | $924 | $18,648 | $1,200 | $17,448 |
| 2024 | $924 | $6,400 | $480 | $5,920 |
| 2023 | $748 | $15,640 | $1,200 | $14,440 |
| 2022 | $758 | $14,641 | $1,200 | $13,441 |
| 2021 | $594 | $8,451 | $1,197 | $7,254 |
| 2020 | $616 | $9,254 | $2,000 | $7,254 |
| 2019 | $636 | $9,182 | $2,000 | $7,182 |
| 2018 | $639 | $9,182 | $2,000 | $7,182 |
| 2017 | $637 | $9,182 | $2,000 | $7,182 |
| 2016 | $637 | $9,182 | $2,000 | $7,182 |
| 2015 | $639 | $9,182 | $2,000 | $7,182 |
| 2014 | $339 | $9,200 | $2,000 | $7,200 |
Source: Public Records
Map
Nearby Homes
- 2007 Clark St
- 2011 Clark St
- 2013 Clark St
- 2003 Clark St
- 105 Curry St
- 2015 Clark St
- 2010 Division St
- 2006 Division St
- 2021 Clark St
- 2008 Clark St
- 2006 Clark St
- 2004 Clark St
- 2002 Division St
- 2020 Edgar St
- 0 Curry St Unit 5437983-9558951
- 0 Curry St Unit 5437983-8094865
- 0 Curry St Unit 5437983-11313877
- 102 Curry St
- 2023 Clark St
- 2002 Clark St
Your Personal Tour Guide
Ask me questions while you tour the home.