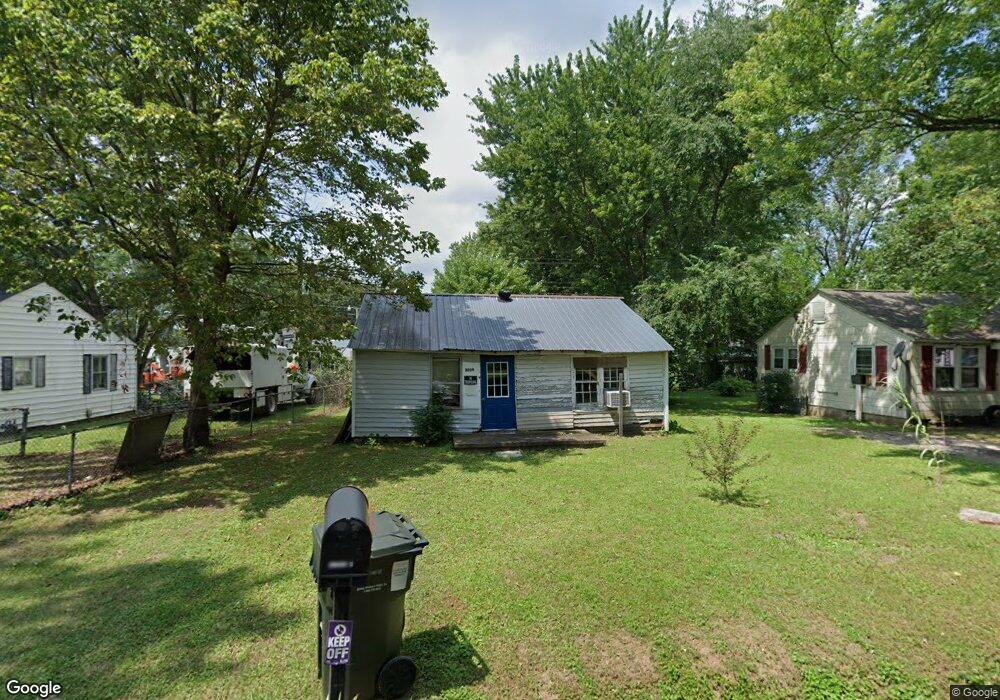
2009 Hawks Loop Humboldt, TN 38343
Estimated Value: $46,628 - $80,000
Studio
1
Bath
672
Sq Ft
$86/Sq Ft
Est. Value
About This Home
This home is located at 2009 Hawks Loop, Humboldt, TN 38343 and is currently estimated at $57,657, approximately $85 per square foot. 2009 Hawks Loop is a home located in Gibson County with nearby schools including Stigall Primary School, East Elementary School, and Humboldt Junior/Senior High School.
Ownership History
Date
Name
Owned For
Owner Type
Purchase Details
Closed on
Aug 3, 2018
Sold by
Hardin James
Bought by
Wandell Raymond T
Current Estimated Value
Purchase Details
Closed on
Oct 8, 2004
Sold by
Swartz & Brough Inc
Bought by
Pickard Kris
Home Financials for this Owner
Home Financials are based on the most recent Mortgage that was taken out on this home.
Original Mortgage
$19,000
Interest Rate
5.75%
Purchase Details
Closed on
Jul 15, 2004
Bought by
Swartz & Brough Inc
Purchase Details
Closed on
May 26, 1999
Sold by
Teague J C Dorothy
Bought by
Bolton Robert H
Purchase Details
Closed on
Jun 12, 1995
Sold by
Teague J C Dorothy
Bought by
Crider Myra Faye Henning
Purchase Details
Closed on
Mar 3, 1961
Bought by
Teague Teague J and Teague Dorothy
Purchase Details
Closed on
Jan 3, 1900
Purchase Details
Closed on
Jan 2, 1900
Create a Home Valuation Report for This Property
The Home Valuation Report is an in-depth analysis detailing your home's value as well as a comparison with similar homes in the area
Home Values in the Area
Average Home Value in this Area
Purchase History
| Date | Buyer | Sale Price | Title Company |
|---|---|---|---|
| Wandell Raymond T | $5,500 | -- | |
| Pickard Kris | $21,000 | -- | |
| Swartz & Brough Inc | $12,000 | -- | |
| Bolton Robert H | $20,000 | -- | |
| Crider Myra Faye Henning | $10,899 | -- | |
| Teague Teague J | -- | -- | |
| -- | -- | -- | |
| -- | -- | -- |
Source: Public Records
Mortgage History
| Date | Status | Borrower | Loan Amount |
|---|---|---|---|
| Previous Owner | Not Available | $19,000 |
Source: Public Records
Tax History
| Year | Tax Paid | Tax Assessment Tax Assessment Total Assessment is a certain percentage of the fair market value that is determined by local assessors to be the total taxable value of land and additions on the property. | Land | Improvement |
|---|---|---|---|---|
| 2025 | $175 | $6,475 | $2,000 | $4,475 |
| 2024 | $175 | $6,475 | $2,000 | $4,475 |
| 2023 | $37 | $3,350 | $875 | $2,475 |
| 2022 | $35 | $3,350 | $875 | $2,475 |
| 2021 | $46 | $4,475 | $875 | $3,600 |
| 2020 | $168 | $4,475 | $875 | $3,600 |
| 2019 | $168 | $4,475 | $875 | $3,600 |
| 2018 | $200 | $4,925 | $875 | $4,050 |
| 2017 | $198 | $4,925 | $875 | $4,050 |
| 2016 | $200 | $5,000 | $875 | $4,125 |
| 2015 | $199 | $5,000 | $875 | $4,125 |
| 2014 | $199 | $5,000 | $875 | $4,125 |
Source: Public Records
Map
Nearby Homes
- 0 Eastend Dr
- 00000 Lot 7 Mullins St
- 000Lot 6-B Mullins St
- 0000 lot 6-C Mullins St
- 00-lot 6-A Mullins St
- 1549 Eastview Dr
- 1819 Dodson St
- 2227 Mullins Ave
- 3309 Eastview Dr
- 1130 N 30th Ave
- 2124 Barrett Ln
- 1321 Eastview Dr
- 1405 Woodhaven St
- 1118 N 32nd Ave
- 1135 N 28th Ave
- 3117 Laurel St
- 1277 Woodhaven St
- 3106 Laurel St
- 1021 Eastview Dr
- 2016 Elliott St
- 2003 Hawks Loop
- 2013 Hawks Loop
- 2006 North St
- 2014 North St
- 2019 Hawks Loop
- 2002 North St
- 2020 North St
- 2024 North St
- 1915 Hawks Loop
- 2021 Hawks Loop A B
- 2014 Hawks Loop
- 2026 North St
- 1922 North St
- 2011 North St Unit 2013
- 2022 Hawks Loop
- 2020 Hawks Loop
- 2007 North St
- 2911 Eastend Dr
- 1911 Hawks Loop
- 2005 North St Unit 2007
Your Personal Tour Guide
Ask me questions while you tour the home.